
Exhibit 99.1 PAYCHEX Payroll HR Retirement Insurance Impacts of ASC 606 and Other Items Fiscal 2018 and Fiscal 2017 Updated as of June 28, 2018 © 2018, PAYCHEX ,Inc. All rights reserved. 1
Forward Looking Statements You should be aware that certain written and oral statements made by management may constitute “forward-looking statements” within the meaning of the safe-harbor provisions of the United States (“U.S.”) Private Securities Litigation Reform Act of 1995. Forward-looking statements are neither historical facts nor assurances of future performance. Instead, they are based only on our current beliefs, expectations, and assumptions regarding the future of our business, future plans and strategies, projections, anticipated events and trends, the economy, and other future conditions. Because forward-looking statements relate to the future, they are subject to inherent uncertainties, risks, and changes in circumstances that are difficult to predict, many of which are outside our control. Our actual results and financial conditions may differ materially from those indicated in the forward-looking statements. Therefore, you should not place undue reliance upon any of these forward-looking statements. The information provided in this document is based upon the facts and circumstances known at this time, and any forward-looking statement made in this document speaks only as of the date on which it was made. We undertake no obligation to update these forward-looking statements after the date of issuance of this document to reflect events or circumstances after the date of release of this information, or to reflect the occurrence of unanticipated events. 2
Use of Non-GAAP Financial Measures To supplement our financial information presented in accordance with generally accepted accounting principles (“GAAP”) in the U.S., we consider and have included certain non-GAAP financial measures including adjusted net income and adjusted diluted earnings per share. We believe adjusted net income, and adjusted diluted earnings per share are appropriate additional measures, as they are indicators of our core business operations performance period over period. Adjusted net income and adjusted diluted earnings per share are not calculated through the application of GAAP and are not a required form of disclosure by the SEC. As such, they should not be considered as a substitute for the GAAP measures of net income and diluted earnings per share, and therefore should not be used in isolation, but in conjunction with the GAAP measures. The use of any non-GAAP measure may produce results that vary from the GAAP measure and may not be comparable to a similarly defined non-GAAP measure used by other companies. In this presentation, any non-GAAP measure referenced is reconciled within the schedule to its closest GAAP measure. Adjustments to GAAP include: Additional expense and corresponding tax benefit recognized in the third quarter of fiscal 2018 as a result of a one-time charge following the termination of certain license agreements, which is not expected to recur. Net tax windfall or shortfall benefits related to employee stock-based compensation payments recognized in income taxes. This item is subject to volatility and will vary based on employee decisions on exercising employee stock options and fluctuations in stock price, neither of which is within the control of management; Tax benefits of $88.5 million recognized in fiscal 2018 due to the one-time revaluation of deferred tax liabilities resulting from the result of the Tax Cuts and Jobs Act enacted in December 2017. 3
Agenda .ASC Topic 606, Revenue from Contracts with Customers,(“ASC 606”) -Adoption for Paychex .Financial impact of implementation of ASC 606 and certain Non- GAAP Adjustments .Restated GAAP and Non-GAAP Income Statements .Fiscal 2019 annual guidance © 2018, PAYCHEX ,Inc. All rights reserved. 4
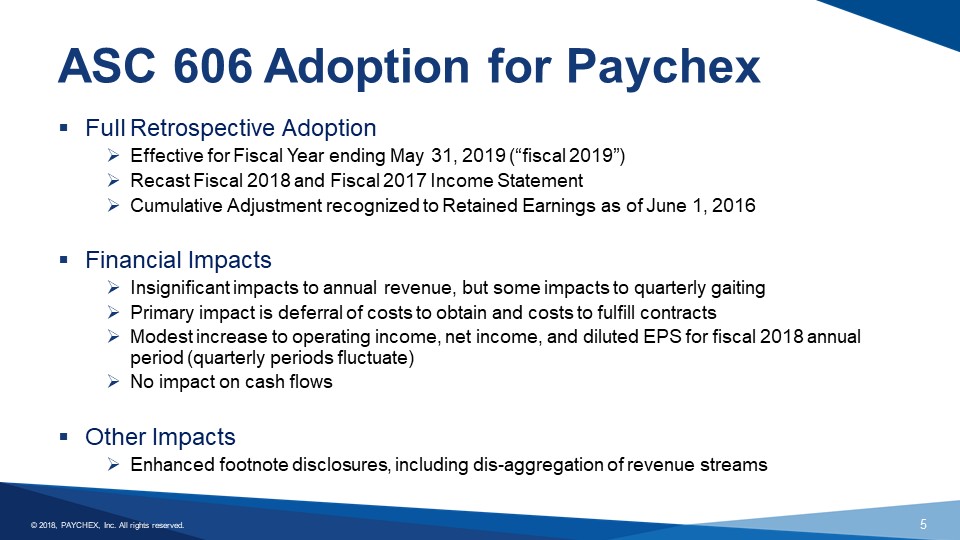
ASC 606 Adoption for Paychex Full Retrospective Adoption Effective for Fiscal Year ending May 31, 2019 (“fiscal 2019”) Recast Fiscal 2018 and Fiscal 2017 Income Statement Cumulative Adjustment recognized to Retained Earnings as of June 1, 2016 Financial Impacts Insignificant impacts to annual revenue, but some impacts to quarterly gaiting Primary impact is deferral of costs to obtain and costs to fulfill contracts Modest increase to operating income, net income, and diluted EPS for fiscal 2018 annual period (quarterly periods fluctuate) No impact on cash flows Other Impacts Enhanced footnote disclosures, including dis-aggregation of revenue streams © 2018, PAYCHEX, Inc. All rights reserved 5
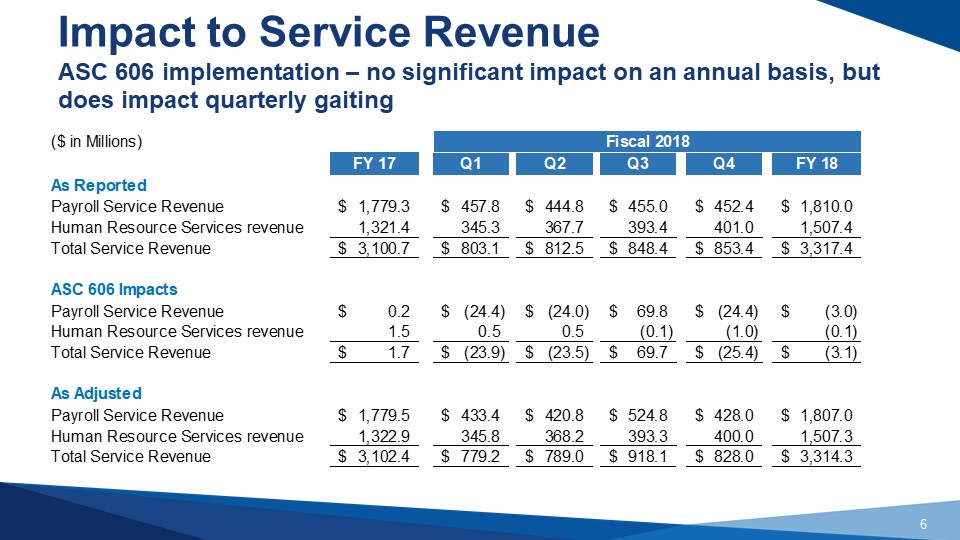
Impact to Service Revenue ASC 606 implementation –no significant impact on an annual basis, but does impact quarterly gaiting ($ in Millions) Fiscal 2018 FY 17 Q1 Q2 Q3 Q4 FY 18 As Reported Payroll Service Revenue $ 1,779.3 $ 457.8 $ 444.8 $ 455.0 $ 452.4 $ 1,810.0 Human Resource Services revenue 1,321.4 345.3 367.7 393.4 401.0 1,507.4 Total Service Revenue $ 3,100.7 $ 803.1 $ 812.5 $ 848.4 $ 853.4 $ 3,317.4 ASC 606 Impacts Payroll Service Revenue $ 0.2 $ (24.4) $ (24.0) $ 69.8 $ (24.4) $ (3.0) Human Resource Services revenue 1.5 0.5 0.5 (0.1) (1.0) (0.1) Total Service Revenue $1.7 $ (23.9) $ (23.5) $ 69.7 $ (25.4) $ (3.1) As Adjusted Payroll Service Revenue $ 1,779.5 $ 433.4 $ 420.8 $ 524.8 $ 428.0 $ 1,807.0 Human Resource Services revenue 1,322.9 345.8 368.2 393.3 400.0 1,507.3 Total Service Revenue $ 3,102.4 $ 779.2 $ 789.0 $ 918.1 $ 828.0 $ 3,314.3 6
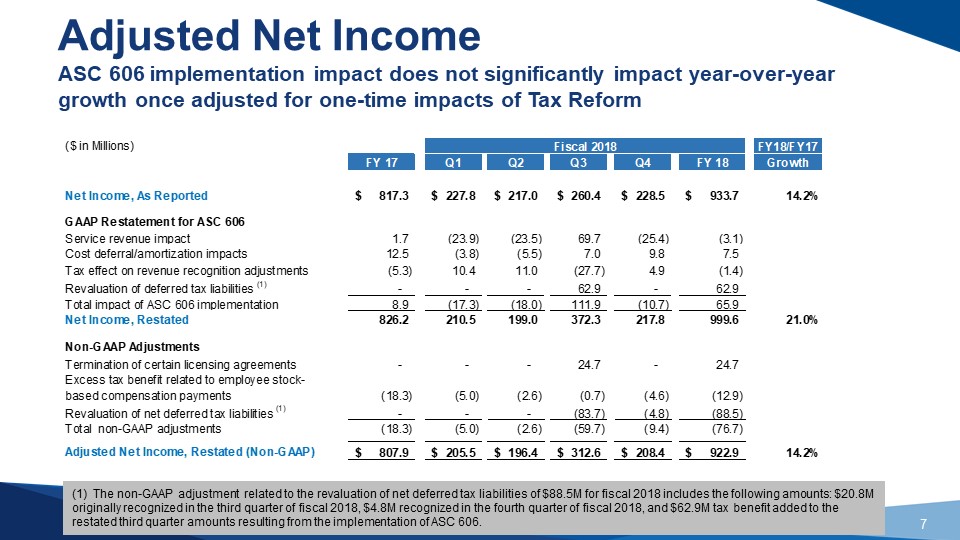
Adjusted Net Income ASC 606 implementation impact does not significantly impact year-over-year growth once adjusted for one-time impacts of Tax Reform ($ in Millions) Fiscal 2018 FY18/FY17 FY 17 Q1 Q2 Q3 Q4 FY 18 Growth Net Income, As Reported $ 817.3 $ 227.8 $ 217.0 $ 260.4 $ 228.5 $ 933.7 14.2% GAAP Restatement for ASC 606 Service revenue impact 1.7 (23.9) (23.5) 69.7 (25.4) (3.1) Cost deferral/amortization impacts 12.5 (3.8) (5.5) 7.0 9.8 7.5 Tax effect on revenue recognition adjustments (5.3) 10.4 11.0 (27.7) 4.9 (1.4) Revaluation of deferred tax liabilities (1) - - - 62.9 - 62.9 Total impact of ASC 606 implementation 8.9 (17.3) (18.0) 111.9 (10.7) 65.9 Net Income, Restated 826.2 210.5 199.0 372.3 217.8 999.6 21.0% Non-GAAP Adjustments Termination of certain licensing agreements- - - 24.7 - 24.7 Excess tax benefit related to employee stock- based compensation payments (18.3) (5.0) (2.6) (0.7) (4.6) (12.9) Revaluation of net deferred tax liabilities (1)- - - (83.7) (4.8) (88.5) Total non-GAAP adjustments (18.3) (5.0) (2.6) (59.7) (9.4) (76.7) Adjusted Net Income, Restated (Non-GAAP) $ 807.9 $ 205.5 $ 196.4 $ 312.6 $ 208.4 $ 922.9 14.2% (1) The non-GAAP adjustment related to the revaluation of net deferred tax liabilities of $88.5M for fiscal 2018 includes the following amounts: $20.8M originally recognized in the third quarter of fiscal 2018, $4.8M recognized in the fourth quarter of fiscal 2018, and $62.9M tax benefit added to the restated third quarter amounts resulting from the implementation of ASC 606. 7
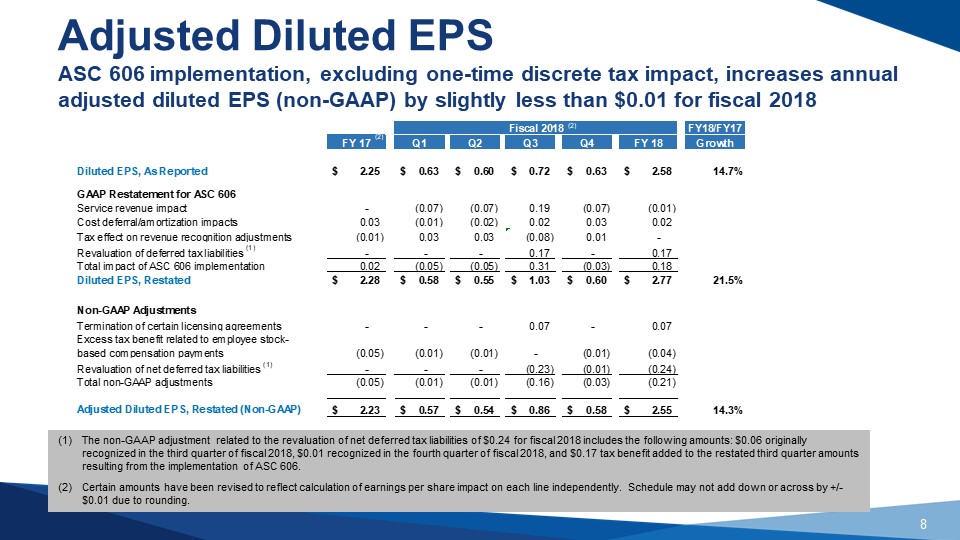
Adjusted Diluted EPS ASC 606 implementation, excluding one-time discrete tax impact, increases annual adjusted diluted EPS (non-GAAP) by slightly less than $0.01 for fiscal 2018 Fiscal 2018 (2) FY18/FY17 FY 17 (2) Q1 Q2 Q3 Q4 FY 18 Growth Diluted EPS, As Reported $ 2.25 $ 0.63 $ 0.60 $ 0.72 $ 0.63 $ 2.58 14.7% GAAP Restatement for ASC 606 Service revenue impact- (0.07) (0.07) 0.19 (0.07) (0.01) Cost deferral/amortization impacts 0.03 (0.01) (0.02) 0.02 0.03 0.02 Tax effect on revenue recognition adjustments (0.01) 0.03 0.03 (0.08) 0.01 - Revaluation of deferred tax liabilities (1)- - - 0.17 - 0.17 Total impact of ASC 606 implementation 0.02 (0.05) (0.05) 0.31 (0.03) 0.18 Diluted EPS, Restated $ 2.28 $ 0.58 $ 0.55 $ 1.03 $ 0.60 $ 2.77 21.5 % Non-GAAP Adjustments Termination of certain licensing agreements- - - 0.07 - 0.07 Excess tax benefit related to employee stock- based compensation payments (0.05) (0.01) (0.01) - (0.01) (0.04) Revaluation of net deferred tax liabilities (1)- - - (0.23) (0.01) (0.24) Total non-GAAP adjustments (0.05) (0.01) (0.01) (0.16) (0.03) (0.21) Adjusted Diluted EPS, Restated (Non-GAAP) $ 2.23 $ 0.57 $ 0.54 $ 0.86 $ 0.58 $ 2.55 14.3% (1) The non-GAAP adjustment related to the revaluation of net deferred tax liabilities of $0.24 for fiscal 2018 includes the following amounts: $0.06 originally recognized in the third quarter of fiscal 2018, $0.01 recognized in the fourth quarter of fiscal 2018, and $0.17 tax benefit added to the restated third quarter amounts resulting from the implementation of ASC 606. (2) Certain amounts have been revised to reflect calculation of earnings per share impact on each line independently. Schedule may not add down or across by +/- $0.01 due to rounding. 8
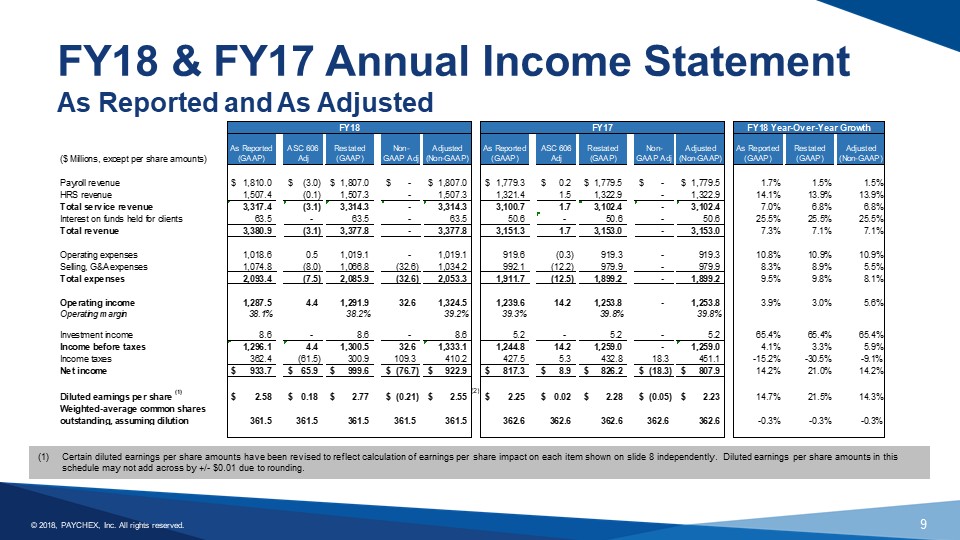
FY18 & FY17 Annual Income Statement As Reported and As Adjusted ($ Millions, except per share amounts) FY18 FY17 FY18 Year-Over-Year-Growth As Reported (GAAP) ASC 606 Adj Restated (GAAP) Non- GAAP Adj Adjusted (Non-GAAP) As Reported (GAAP) ASC 606 Adj Restated (GAAP) Non- GAAP Adj Adjusted (Non-GAAP) As Reported (GAAP) Restated (GAAP) Adjusted (Non-GAAP) Payroll revenue $ 1,810.0 $ (3.0) $ 1,807.0 $ - $ 1,807.0 $ 1,779.3 $ 0.2 $ 1,779.5 $ -$ 1,779.5 1.7% 1.5% 1.5% HRS revenue 1,507.4 (0.1) 1,507.3 - 1,507.3 1,321.4 1.5 1,322.9 - 1,322.9 14.1% 13.9% 13.9% Total service revenue 3,317.4 (3.1) 3,314.3 - 3,314.3 3,100.7 1.7 3,102.4 - 3,102.4 7.0% 6.8% 6.8% Interest on funds held for clients 63.5 - 63.5 - 63.5 50.6 - 50.6 - 50.6 25.5% 25.5% 25.5% Total revenue 3,380.9 (3.1) 3,377.8 - 3,377.8 3,151.3 1.7 3,153.0 - 3,153.0 7.3% 7.1% 7.1% Operating expenses 1,018.6 0.5 1,019.1 - 1,019.1 919.6 (0.3) 919.3 - 919.3 10.8% 10.9% 10.9% Selling, G&A expenses 1,074.8 (8.0) 1,066.8 (32.6) 1,034.2 992.1 (12.2) 979.9 - 979.9 8.3% 8.9% 5.5% Total expenses 2,093.4 (7.5) 2,085.9 (32.6) 2,053.3 1,911.7 (12.5) 1,899.2 - 1,899.2 9.5% 9.8% 8.1% Operating income 1,287.5 4.4 1,291.9 32.6 1,324.5 1,239.6 14.2 1,253.8 - 1,253.8 3.9% 3.0% 5.6% Operating margin 38.1% 38.2% 39.2% 39.3% 39.8% 39.8% Investment income 8.6 - 8.6 - 8.6 5.2 - 5.2 - 5.2 65.4% 65.4% 65.4% Income before taxes 1,296.1 4.4 1,300.5 32.6 1,333.1 1,244.8 14.2 1,259.0 - 1,259.0 4.1% 3.3% 5.9% Income taxes 362.4 (61.5) 300.9 109.3 410.2 427.5 5.3 432.8 18.3 451.1 -15.2%-30.5%-9.1% Net income $ 933.7 $ 65.9 $ 999.6 $ (76.7) $ 922.9 $ 817.3 $ 8.9 $ 826.2 $ (18.3) $ 807.9 $ 14.2% 21.0% 14.2% Diluted earnings per share (1) $ 2.58 $ 0.18 $ 2.77 $ (0.21) $ 2.55 $ 2.25 $ 0.02 $ 2.28 $ (0.05) $ 2.23 $ 14.7% 21.5% 14.3% Weighted-average common shares outstanding, assuming dilution 361.5 361.5 361.5 361.5 361.5 362.6 362.6 362.6 362.6 362.6 -0.3% -0.3% -0.3% (1) Certain diluted earnings per share amounts have been revised to reflect calculation of earnings per share impact on each item shown on slide 8 independently. Diluted earnings per share amounts in this schedule may not add across by +/-$0.01 due to rounding. © 2018, PAYCHEX, Inc. All rights reserved 9
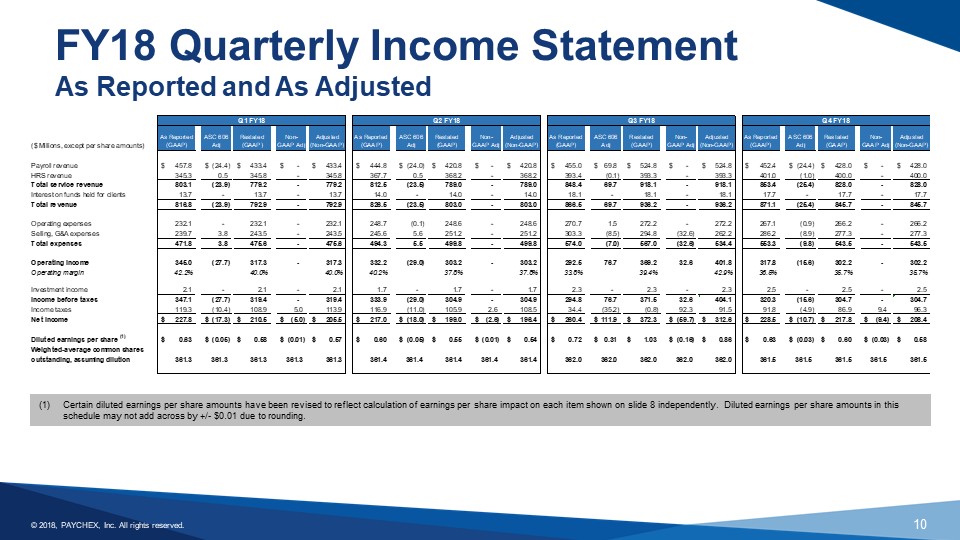
FY18 Quarterly Income Statement As Reported and As Adjusted Q1FY18 Q2FY2018 Q3FY2018 Q4FY2018 ($ Millions, except per share amounts) As Reported (GAAP) ASC 606 Adj Restated (GAAP) Non- GAAP Adj Adjusted (Non-GAAP) As Reported (GAAP) ASC 606 Adj Restated (GAAP) Non- GAAP Adj Adjusted (Non-GAAP) As Reported (GAAP) ASC 606 Adj Restated (GAAP) Non- GAAP Adj Adjusted (Non-GAAP) As Reported (GAAP) ASC 606 Adj Restated (GAAP) Non- GAAP Adj Adjusted (Non-GAAP) Payroll revenue $ 457.8 $ (24.4) $ 433.4 $ -$ 433.4 $ 444.8 $ (24.0) $ 420.8 $ - $ 420.8 $ 455.0 $ 69.8 $ 524.8 $ -$ 524.8 $ 452.4 $ (24.4) $ 428.0 $ - $ 428.0 $ HRS revenue 345.3 0.5 345.8 - 345.8 367.7 0.5 368.2 - 368.2 393.4 (0.1) 393.3 - 393.3 401.0 (1.0) 400.0 - 400.0 Total service revenue 803.1 (23.9) 779.2 - 779.2 812.5 (23.5) 789.0 - 789.0 848.4 69.7 918.1 - 918.1 853.4 (25.4) 828.0 - 828.0 Interest on funds held for clients 13.7 - 13.7 - 13.7 14.0 - 14.0 - 14.0 18.1 - 18.1 - 18.1 17.7 - 17.7 - 17.7 Total revenue 816.8 (23.9) 792.9 - 792.9 826.5 (23.5) 803.0 - 803.0 866.5 69.7 936.2 - 936.2 871.1 (25.4) 845.7 - 845.7 Operating expenses 232.1 - 232.1 - 232.1 248.7 (0.1) 248.6 - 248.6 270.7 1.5 272.2 - 272.2 267.1 (0.9) 266.2 - 266.2 Selling, G&A expenses 239.7 3.8 243.5 - 243.5 245.6 5.6 251.2 - 251.2 303.3 (8.5) 294.8 (32.6) 262.2 286.2 (8.9) 277.3 - 277.3 Total expenses 471.8 3.8 475.6 - 475.6 494.3 5.5 499.8 - 499.8 574.0 (7.0) 567.0 (32.6) 534.4 553.3 (9.8) 543.5 - 543.5 Operating income 345.0 (27.7) 317.3 - 317.3 332.2 (29.0) 303.2 - 303.2 292.5 76.7 369.2 32.6 401.8 317.8 (15.6) 302.2 - 302.2 Operating margin 42.2% 40.0% 40.0% 40.2% 37.8% 37.8% 33.8% 39.4% 42.9% 36.5% 35.7% 35.7% Investment income 2.1 - 2.1 - 2.1 1.7 - 1.7 - 1.7 2.3 - 2.3 - 2.3 2.5 - 2.5 - 2.5 Income before taxes 347.1 (27.7) 319.4 - 319.4 333.9 (29.0) 304.9 - 304.9 294.8 76.7 371.5 32.6 404.1 320.3 (15.6) 304.7 - 304.7 Income taxes 119.3 (10.4) 108.9 5.0 113.9 116.9 (11.0) 105.9 2.6 108.5 34.4 (35.2) (0.8) 92.3 91.5 91.8 (4.9) 86.9 9.4 96.3 Net income $ 227.8 $ (17.3) $ 210.5 $ (5.0) $ 205.5 $ 217.0 $ (18.0) $ 199.0 $ (2.6) $ 196.4 $ 260.4 $ 111.9 $ 372.3 $ (59.7) $ 312.6 $ 228.5 $ (10.7) $ 217.8 $ (9.4) $ 208.4 $ Diluted earnings per share (1) $ 0.63 $ (0.05) $ 0.58 $ (0.01) $ 0.57 $ 0.60 $ (0.05) $ 0.55 $ (0.01) $ 0.54 $ 0.72 $ 0.31 $ 1.03 $ (0.16) $ 0.86 $ 0.63 $ (0.03) $ 0.60 $ (0.03) $ 0.58 Weighted-average common shares outstanding, assuming dilution 361.3 361.3 361.3 361.3 361.3 361.4 361.4 361.4 361.4 361.4 362.0 362.0 362.0 362.0 362.0 361.5 361.5 361.5 361.5 361.5 (1)Certain diluted earnings per share amounts have been revised to reflect calculation of earnings per share impact on each item shown on slide 8 independently. Diluted earnings per share amounts in this schedule may not add across by +/-$0.01 due to rounding. © 2018, PAYCHEX, Inc. All rights reserved 10
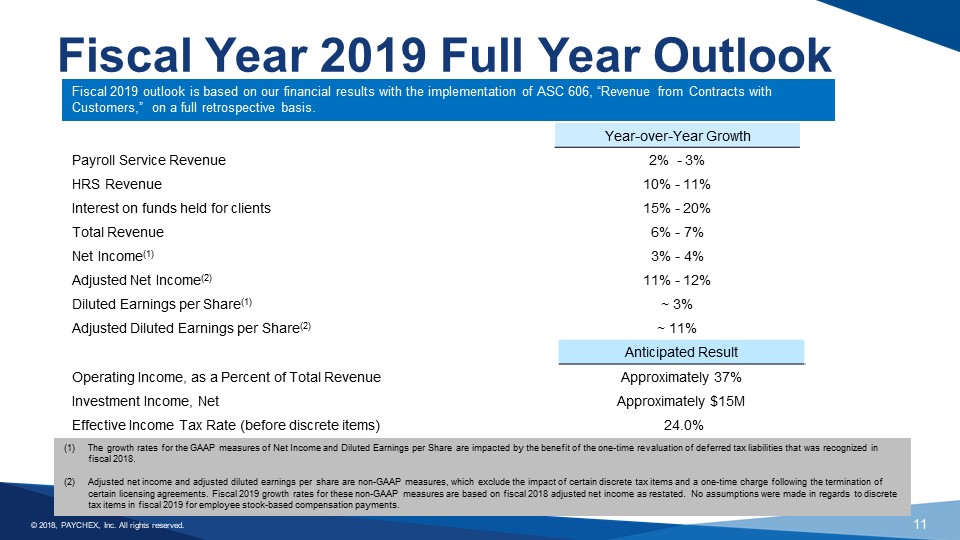
Fiscal Year 2019 Full Year Outlook Fiscal 2019 outlook is based on our financial results with the implementation of ASC 606, “Revenue from Contracts with Customers,” on a full retrospective basis. Year-over-Year Growth Payroll Service Revenue 2% -3% HRS Revenue 10% -11% Interest on funds held for clients 15% -20% Total Revenue 6% -7% Net Income (1) 3% -4% Adjusted Net Income (2) 11% -12% Diluted Earnings per Share (1) ~ 3% Adjusted Diluted Earnings per Share (2) ~ 11% Anticipated Result Operating Income, as a Percent of Total Revenue Approximately 37% Investment Income, Net Approximately $15M Effective Income Tax Rate (before discrete items) 24.0% (1) The growth rates for the GAAP measures of Net Income and Diluted Earnings per Share are impacted by the benefit of the one-time revaluation of deferred tax liabilities that was recognized in fiscal 2018. (2) Adjusted net income and adjusted diluted earnings per share are non-GAAP measures, which exclude the impact of certain discrete tax items and a one-time charge following the termination of certain licensing agreements. Fiscal 2019 growth rates for these non-GAAP measures are based on fiscal 2018 adjusted net income as restated. No assumptions were made in regards to discrete tax items in fiscal 2019 for employee stock-based compensation payments. © 2018, PAYCHEX, Inc. All rights reserved 11

PAYCHEX Payroll HR Retirement Insurance © 2018, PAYCHEX, Inc. All rights reserved 12