UNITED STATES
SECURITIES AND EXCHANGE COMMISSION
WASHINGTON, D.C. 20549
_________________________________________
FORM
_________________________________________
For the fiscal year ended
OR
For the transition period from __________to __________
Commission file number
____________________________________
(Exact name of registrant as specified in its charter)
|
|
|
(State or other jurisdiction of incorporation or organization) |
|
(I.R.S. Employer Identification No.) |
(Address of principal executive offices) |
|
(Zip Code) |
Registrant’s telephone number, including area code: (
Securities registered pursuant to Section 12(b) of the Act:
Title of each class |
Trading Symbol(s) |
Name of each exchange on which registered |
Securities registered pursuant to Section 12(g) of the Act: None
Indicate by check mark if the registrant is a well-known seasoned issuer, as defined in Rule 405 of the Securities Act.
Indicate by check mark if the registrant is not required to file reports pursuant to Section 13 or Section 15(d) of the Act. Yes
Indicate by check mark whether the registrant (1) has filed all reports required to be filed by Section 13 or 15(d) of the Securities Exchange Act of 1934 during the preceding 12 months (or for such shorter period that the registrant was required to file such reports), and (2) has been subject to such filing requirements for the past 90 days.
Indicate by check mark whether the registrant has submitted electronically every Interactive Data File required to be submitted pursuant to Rule 405 of Regulation S-T (§232.405 of this chapter) during the preceding 12 months (or for such shorter period that the registrant was required to submit such files).
Indicate by check mark whether the registrant is a large accelerated filer, an accelerated filer, a non-accelerated filer, a smaller reporting company, or an emerging growth company. See the definitions of “large accelerated filer,” “accelerated filer,” “smaller reporting company,” and “emerging growth company” in Rule 12b-2 of the Exchange Act.
|
|
|
|
|
|
|
|
Accelerated Filer |
|
Non-accelerated Filer |
|
Smaller Reporting Company |
|
|
|
|
|
|
|
Emerging Growth Company |
If an emerging growth company, indicate by check mark if the registrant has elected not to use the extended transition period for complying with any new or revised financial accounting standards provided pursuant to Section 13(a) of the Exchange Act.
Indicate by check mark whether the registrant has filed a report on and attestation to its management’s assessment of the effectiveness of its internal control over financial reporting under Section 404(b) of the Sarbanes-Oxley Act (15 U.S.C. 7262(b)) by the registered public accounting firm that prepared or issued its audit report.
If securities are registered pursuant to Section 12(b) of the Act, indicate by check mark whether the financial statements of the registrant included in the filing reflect the correction of an error to previously issued financial statements. ¨
Indicate by check mark whether any of those error corrections are restatements that required a recovery analysis of incentive-based compensation received by any of the registrant’s executive officers during the relevant recovery period pursuant to §240.10D-1(b). ¨
As of November 30, 2022, the last business day of the most recently completed second fiscal quarter, shares held by non-affiliates of the registrant had an aggregate market value of $
As of June 30, 2023,
Documents Incorporated by Reference
Portions of the registrant’s definitive proxy statement to be issued in connection with its Annual Meeting of Stockholders to be held on or about October 12, 2023, to the extent not set forth herein, are incorporated by reference into Part III, Items 10 through 14, inclusive.
PAYCHEX, INC.
INDEX TO FORM 10-K
For the fiscal year ended May 31, 2023
i
PART I
CAUTIONARY NOTE REGARDING FORWARD-LOOKING STATEMENTS
Certain written and oral statements made by management of Paychex, Inc. and its wholly owned subsidiaries (“Paychex,” the “Company,” “we,” “our,” or “us”) may constitute “forward-looking statements” within the meaning of the safe harbor provisions of the United States (“U.S.”) Private Securities Litigation Reform Act of 1995. Forward-looking statements can be identified by such words and phrases as “expect,” “estimate,” “intend,” “intent,” “outlook,” “will,” “would,” “projections,” “strategy,” “mission,” “anticipate,” “believe,” “could,” “may,” “target,” “potential,” “purpose,” “design,” and other similar words or phrases. Examples of forward-looking statements include, among others, statements we make regarding operating performance, events, or developments that we expect or anticipate will occur in the future, including statements relating to our outlook, revenue growth, earnings, earnings-per-share growth, or similar projections.
Forward-looking statements are neither historical facts nor assurances of future performance. Instead, they are based only on our current beliefs, expectations, and assumptions regarding the future of our business, future plans and strategies, projections, anticipated events and trends, the economy, and other future conditions. Because forward-looking statements relate to the future, they are subject to inherent uncertainties, risks, and changes in circumstances that are difficult to predict, many of which are outside our control. Our actual results and financial condition may differ materially from those indicated in the forward-looking statements. Therefore, you should not place undue reliance upon any of these forward-looking statements. Important factors that could cause our actual results and financial condition to differ materially from those indicated in the forward-looking statements include, among others, the following:
1
Any of these factors, as well as such other factors as discussed in Part I, Item 1A, “Risk Factors” and throughout Part II, Item 7, “Management’s Discussion and Analysis of Financial Condition and Results of Operations” of this Annual Report on Form 10‑K (“Form 10-K”), and in our periodic filings with the Securities and Exchange Commission (the “SEC”), could cause our actual results to differ materially from our anticipated results. The information provided in this Form 10‑K is based upon the facts and circumstances known as of the date of this report, and any forward-looking statements made by us in this Form 10‑K speak only as of the date on which they are made. Except as required by law, we undertake no obligation to update these forward-looking statements after the date of filing this Form 10-K with the SEC to reflect events or circumstances after such date, or to reflect the occurrence of unanticipated events.
Our investor presentation regarding the financial results for the fiscal year ended May 31, 2023 is available and accessible on our Paychex Investor Relations portal at https://investor.paychex.com. Information available on our website is not a part of, and is not incorporated into, this Form 10-K. We intend to make future investor presentations available exclusively on our Paychex Investor Relations portal.
2
Item 1. Business
Unless we state otherwise or the context otherwise requires, the terms “Paychex,” “we,” “us,” “our” and the “Company” refer to Paychex, Inc., a Delaware corporation, and its consolidated subsidiaries.
Overview
We are a leading provider of human capital management (“HCM”) solutions for human resources (“HR”), payroll, benefits, and insurance for small- to medium-sized businesses and their employees across the U.S. and parts of Europe. We offer a comprehensive portfolio of HCM technology and HR advisory solutions that help our clients navigate the evolving challenges of HR.
Paychex was incorporated in Delaware in 1979 and has a fiscal year that ends May 31st. We maintain our corporate headquarters in Rochester, New York, and serve clients throughout the U.S. and parts of Europe. As of May 31, 2023, we served approximately 740,000 payroll and PEO clients.
For any organization, a key function is effective HCM, which requires both resources and expertise. Organizations are faced with complex and ever-changing requirements, including diverse and complicated federal, state, and local regulations across multiple jurisdictions. In addition, the workplace is rapidly changing as employees increasingly become mobile, work remotely, and expect a user experience similar to consumer-oriented applications. We specialize in helping small- to medium-sized businesses who do not have the resources or expertise to adapt to the constantly evolving environment.
Paychex offers a wide range of solutions – including HR outsourcing, HCM technology, payroll processing, retirement and insurance solutions – allowing us to customize our offering to the client's business, whether it is small or large, simple or complex. We believe that we have the breadth of solutions to cover the spectrum of the employee life cycle, but we also allow integration with some of the most popular HR, accounting, point-of-sale, and productivity applications on the market today.
Our comprehensive solutions allow our clients to manage their workforces effectively from hire to retire. We provide leading-edge HCM technology, coupled with human expertise, to make complex HR, payroll, and benefits issues simple for our clients. The key features of our solutions are:
We market our solutions through our direct and virtual sales forces which are supported by various corporate lead generation and marketing initiatives. Over 50% of our revenues are gained from our services beyond payroll processing.
Company Strategy
Our strategy is to be the leading provider of HCM solutions for HR, payroll, benefits, and insurance by being an essential partner to small- and medium-sized businesses. We believe that successfully executing this strategy will lead to strong, long-term financial performance. We intend to strengthen and extend our position as a leading provider through continued investments in both our innovative technology and HR advisory solutions. Key elements of our strategy include:
3
Our Solutions
Our solutions bring together payroll and HCM software with HR and compliance expertise, along with flexible, personalized, and technology-enabled support capabilities. Clients have the option of doing payroll online using our SaaS technology, outsourcing to our payroll specialists, or using a combination of these methods. Payroll is integrated with HCM software modules for clients who have more complex HR needs. We also provide comprehensive HR outsourcing through our administrative services organization (“ASO”) and PEO solutions. The integration of leading-edge technology and flexible support options allows us to meet our clients’ needs how, when, and where they want.
We closely monitor the evolving challenges and needs of small- and medium-sized businesses, and proactively aid our clients in navigating macroeconomic challenges, legislative changes, and other complexities they face. In the fiscal year ended May 31, 2023 (“fiscal 2023”), top challenges for employers were macroeconomic pressures including inflation and interest rates, maintaining sufficient staffing levels, providing appropriate employee development, keeping technology current, and ensuring legal and regulatory compliance.
We provide a unique blend of innovative technology solutions, backed by our extensive compliance and HR expertise, that help customers more effectively hire, engage, train, and retain top talent in this challenging workforce environment. As businesses operate in a tight labor market, having an online portal for employee self-service that is intuitive and easy-to-use helps increase employee retention and efficiency for our customers. We continue to invest in our technology, enhancing our solutions to continuously improve the customer and employee experiences from hiring and onboarding through employee retention.
HCM Technology: Paychex Flex is our proprietary HCM SaaS platform that provides seamless workforce management throughout the employee life cycle from recruiting and hiring to retirement through an integrated suite of solutions including recruiting, onboarding, HR, time and attendance and employee benefits. It utilizes a single cloud-based platform, with single client and employee records. Clients can select the modules they need and easily customize solutions as they grow. In addition, Paychex Flex presents function-focused analytics throughout the platform, providing HR leaders with data to make more informed business decisions. Paychex Flex uses a device-independent design throughout the HCM suite, which allows full functionality of all application components, regardless of device or screen size. We believe our Paychex mobile solutions add greater value and convenience for our clients and their employees by allowing them instant access on their mobile device, and we have experienced strong growth in mobile and self-service usage over the past year.
HR and Compliance Expertise: Paychex supports its HCM software solutions with 50+ years of experience. We have approximately 700 HR business professionals who are dedicated to our clients and have the experience and training to provide HR best practices and advice. Our HR business partners are available to provide our ASO and PEO clients with specific guidance on HR issues. In addition, we have over 250 compliance professionals who are in real-time contact with tax agencies and regulators to understand upcoming or newly enacted laws and regulations and advocate for our clients’ interests. The contributions of these compliance experts are intended to ensure that our HCM solutions are updated timely to adhere to regulations and to help our clients stay in compliance.
Technology-Enabled Client Service: Paychex Flex also provides technology-enabled service with options that include self-service, a 24/7 dedicated service center, an individual payroll specialist, and integrated service via a multi-product service center. In addition, medium-sized clients can utilize a relationship manager for more personalized service. This flexible platform services our small- to medium-sized clients and a portion of our PEO business.
4
Within Paychex Flex, we leverage embedded AI to assist our clients. Our Paychex Flex Intelligence Engine allows individual preference on learning style - via written how-to-documents, tutorial-style video vignettes, or a guided interactive tour. The Paychex Flex Intelligence Engine also includes the Flex Assistant, a customer service chatbot that can answer questions across thousands of topics and provides access to over 1,200 instructional resources. At any time, a live Paychex agent is just a click away, with the entire chat conversation available in real-time to provide a more personalized service experience. The Flex Assistant consistently handles nearly two-thirds of questions that would otherwise reach a payroll/HR functionary or a customer service representative, with high satisfaction scores.
The platform embeds self-service capabilities that empower client employees to manage their HR and benefits information from any location, on any device. These self-service capabilities allow for greater access and convenience for client employees and greater productivity for clients.
Our Clients
Paychex has HR solutions to fit the needs of any small- to medium-sized business, from do-it-yourself payroll to comprehensive HR outsourcing. The target market for our integrated HCM solutions is small- to medium-sized businesses. Within this space, we serve a diverse client base operating in a broad range of industries throughout the U.S. and parts of Europe. The flexibility and scalability of our solutions allow our clients to select the best solution that meets their needs. We utilize service agreements and arrangements with clients that generally do not contain specified contract periods and may be terminated by either party with 30-days notice of termination. We believe client retention is a useful indicator of client satisfaction with our solutions and support. For fiscal 2023, client retention was in the range of 82% to 83% of our beginning client base.
We support our small-business clients, reducing the complexity and risk of running their own payroll, while ensuring greater accuracy with up-to-date tax rates and regulatory information. We simplify their payroll with a combination of our solutions and customer support options for a quick and easy payday. Clients may choose to have our service team handle everything for them, or process payroll themselves utilizing our proprietary, robust SaaS Paychex Flex platform and our SurePayroll® SaaS-based solutions. Both solutions allow users to process payroll when they want, how they want, and on any device (desktop, tablet, and mobile phone).
While Paychex Flex is our primary SaaS-based platform utilized by the majority of our clients for their HCM needs, there are some clients that use other platforms, including SurePayroll clients, and certain PEO clients.
Both our small- and medium-sized clients can choose one of our comprehensive HR outsourcing services, which include ASO and PEO solutions, and participate in our benefits offerings, which include our insurance and retirement services. Our insurance services simplify the insurance process to make it easy to find plans with the features and affordability to meet the client’s needs. Our retirement services solutions offer many plan design options to meet the client’s requirements, as well as investment options.
Description of Solutions
Within our HCM solutions we offer a comprehensive portfolio of HCM technology and HR advisory solutions that allow our clients to meet their diverse HR and payroll needs. Clients can select solutions on an á la carte basis or as part of various solution bundles. Our offerings often leverage the information gathered in our base payroll processing service, allowing us to provide comprehensive outsourcing services covering the HCM spectrum.
Our portfolio of solutions is comprised of the following:
Management Solutions:
5
We also allow employers to opt for more flexible pay options. Same day ACH functionality is also available for clients using direct deposit, allowing employers the flexibility to pay employees via direct deposit on the same day they initiate payroll. In addition, we are giving business owners the ability to leverage real-time payments to process payroll and deliver net pay to their employees immediately for time worked. Pay-on-demand functionality enables an employee to request access to a portion of earned pay before the scheduled pay date, which is deposited into a traditional bank account or a third-party account.
6
PEO and Insurance Solutions:
Sales and Marketing
We market and sell our solutions and support primarily through our direct sales force based in the markets we serve. Our direct sales force includes sales representatives who have defined geographical territories and specialize within our portfolio of solutions. Our sales representatives are also supported by marketing, advertising, public relations, trade shows, and telemarketing programs. Our virtual sales force manages inbound sales leads for the under twenty employee space, sales in areas without a direct sales force presence, and sales of various ancillary solutions.
7
In addition to our direct selling and marketing efforts, we utilize other indirect sales channels such as our relationships with existing clients, certified public accountants (“CPAs”), and banks for new client referrals. More than 50% of our new small-market payroll clients (excluding business acquisitions) come from these referral sources. Our dedicated business development group drives sales through banking, national associations, and franchise channels. We also utilize digital marketing as a means to market our services.
We have a long-standing partnership with the American Institute of Certified Public Accountants (“AICPA”) as the preferred payroll provider for its AICPA Business SolutionsTM Program. Our current partnership agreement with the AICPA is in place through September 2025. We also partner with numerous state CPA society organizations.
Our website is available at www.paychex.com. It is a cost-efficient channel that serves as a source of leads and new sales, while complementing the efforts of our direct and virtual sales forces. The website allows us to market to existing and prospective clients that want to learn more about our solutions and support, and offers information about our core lines of business: human resources (www.paychex.com/human-resources), payroll (www.paychex.com/payroll), benefits (www.paychex.com/employee-benefits), and insurance (www.paychex.com/business-insurance).
Paychex also builds on its reputation as an expert in the HCM industry by providing education and assistance primarily to businesses and the CPA community. We provide free webinars, podcasts, white papers, and other information on our website to inform businesses on the impact of regulatory change as well as HR and business best practices. Paychex WORX, available at www.paychex.com/worx, is a digital destination for insightful resources useful for businesses at every stage, from entrepreneur to enterprise. Paychex WORX highlights our expertise and ability to help businesses of all sizes with a wide range of HR and financial information for current clients and prospects alike.
We also track current regulatory issues that impact the business community and provide regulatory updates. We issue small business trend reports through our Paychex | IHS Markit Small Business Employment Watch. Our Paychex Accountant Knowledge Center is a free online resource available through our website that brings valuable information and time-saving online tools to accounting professionals. Through Paychex Flex, AccountantHQ offers access to authorized client payroll and HR data and key account contacts, along with an extensive accountant resource library. AccountantHQ drives efficiency by putting accountants in the best position possible to easily access critical client payroll and HR data, as well as powerful reporting tools.
Markets and Competition
We remain focused on servicing small- to medium-sized businesses based upon the growth potential that we believe exists in the markets we serve. Our internal database source indicates that in the U.S., there are approximately 8 million employer firms in our target markets.
The market for HCM services is highly competitive and fragmented. We have one primary national competitor and we also compete with other national, international, regional, local, and online service providers. In addition to traditional payroll processing and HR service providers, we compete with in-house payroll and HR systems and departments. Payroll and HR systems and software are sold by many vendors. Our solutions also compete with a variety of providers of HR services, such as retirement services companies, insurance companies, HR and benefits consulting firms, and national and regional PEOs.
Competition in the payroll processing and HR services industry is primarily based on service responsiveness, product quality and reputation, including ease of use and accessibility of technology, breadth of service and product offerings, and price. We believe we are competitive in each of these areas. We believe that our leading-edge technology and mobility applications, combined with personalized support provided by industry professionals and our technology-enabled solution capabilities, distinguishes us from our competitors.
Software Maintenance and Development
The ever-changing mandates of federal, state, and local tax and regulatory agencies require us to regularly update our proprietary software to provide payroll and HR services to our clients. We are continually engaged in developing enhancements to and maintaining our various software platforms to meet the changing requirements of our clients and the marketplace. We continue to enhance our SaaS solutions and mobility applications to offer our users an integrated and unified experience. Continued enhancement of the client and client employee experience is important to our future success.
8
Human Capital
We believe our ability to attract and retain qualified employees in all areas of our business is critical to our future success and growth. We strive to foster a diverse, equitable, and inclusive (“DE&I”) workplace; attract, retain, and develop talented employees; and keep them safe. In fiscal 2023, we were a signatory to the CEO Action for Diversity & Inclusion pledge, the single largest business-led initiative to advance DE&I in the workplace. We also created a new DE&I leadership position to ensure that our efforts in building and sustaining a diverse culture of inclusion are realized.
For detailed information regarding our human capital activities, we encourage investors to visit our Corporate Responsibility website page at https://www.paychex.com/corporate/corporate-responsibility. We have also made our Environmental, Social and Governance (“ESG”) report available on our website. The information contained on our website and in our ESG report is not and should not be viewed as being incorporated by reference into this Form 10-K.
Our Employees: As of May 31, 2023, we employed approximately 16,600 people, primarily in the U.S. and on a full-time basis. None of our employees were covered by collective bargaining agreements. We have not experienced a strike or similar work stoppage, and we consider our relations with our employees to be good.
Paychex Culture: Our core cultural values (“Paychex Values”) are designed to guide decision making aligned to the expectations of clients, stockholders, regulators, employees, and the multiple communities in which we operate and to reflect our continuing commitment to DE&I. The Paychex Values are:
Integrity |
Accountability |
Innovation |
Partnership |
Respect |
Service |
Each of these values guide our decision-making process and are critical to our ongoing success. All employees are required to verify their understanding and observance of these values during our annual “Right Way” training, review these values with management during periodic performance discussions, and are further encouraged to attend ongoing training during the year. Volunteer “Culture Champions” throughout the Company also help promote these values daily. We encourage employee feedback through our employee engagement surveys, as described below. This approach empowers our employees and allows us to make a positive impact in the communities we work and serve. As a result of our commitment to these principles, in 2023 we were recognized by Ethisphere, a global leader in defining and advancing the standards of ethical business practices, as one of the World’s Most Ethical Companies. We have achieved this recognition 15 times, and consecutively since 2012. In addition, we were also recognized by Forbes as a Best Employer for Diversity for 2023.
Talent Acquisition and Development: We compete for talent along with our direct competitors and other companies in the geographic areas we serve. We invest significant resources to attract and retain top talent. Our Talent Acquisition Team, in conjunction with certain third-party partners, have developed comprehensive processes to identify and recruit accomplished professionals.
Once hired, our world-class Training Department provides functional training for payroll and HCM specialists and sales associates and also offers personal training, professional development, and leadership-development programs. As a result of our efforts, we have been recognized as one of the top training organizations in the world with a 2023 Training APEX Award presented by Training magazine. Paychex ranked number five on the prestigious list for the second year. This is also the Company's 22nd consecutive appearance on the list that identifies organizations that excel at training and employee development.
Comprehensive Compensation and Benefits: We are committed to providing a fair wage and a total rewards package that allows our employees to be their best in every area of their lives. We regularly review employee salaries to ensure we are competitive in the industry and offer financial benefits such as a 401(k) plan, employee stock purchase plan, tuition assistance, scholarships for children of employees, and financial education. We are also committed to rewarding employees with comprehensive and competitive benefits and well-being package which includes medical, prescription, dental, and vision insurance, short- and long-term disability, employee assistance program, paid family leave, and a variety of well-being programs. For fiscal 2023, compensation-related expenses accounted for approximately 60% of our total expenses.
Employee Well-being Initiatives: In addition to providing a comprehensive compensation and benefits package, we are committed to providing a safe and healthy workplace for our employees. Healthier employees are at lower risk of injury from workplace related exposures, perform work more safely with lower rates of absenteeism, experience better job performance, and can live their lives more fully outside of work. Our well-being program is a robust program focusing on the physical, emotional, community, career, and financial health of our employees.
9
Our award-winning well-being initiatives offer a wide variety of services, tools, and resources that can help employees achieve their health goals using a holistic approach. In addition, we sponsor onsite health screenings, Red Cross blood donation events, flu vaccination clinics, vaping and tobacco cessation, weight management, resiliency training, meditation and yoga classes, and a variety of other programs. Similar to our Culture Champions, we also promote the use of “Well-Being Champions” - Paychex employees who serve as a liaison between the Employee Well-Being Program and their team members. Our employees’ financial well-being is equally important, so we have developed programs for financial education and support. We maintain procedures for events such as fires, severe weather, medical emergencies, and active shooters, as well as other important information related to general workforce safety.
In recognizing the ever-growing diversity of our workplace, we annually celebrate Paychex Culture Day. This is an additional paid day off for employees to celebrate and recognize a holiday that is significant to them. This is just one of the many ways we celebrate our unique heritages, and it reflects our Company's commitment to DE&I and flexibility.
Employee Engagement: We regularly ask our employees to share their views on working at Paychex through company-wide engagement surveys. Facilitated internally by our Human Resources Organizational Development Team, the survey methodology is periodically updated to reflect currents trends and issues including company direction and strategy, DE&I, individual development, collaboration, and our Paychex Values. A third-party administers the survey in order to maintain confidentiality of responses. We use the survey responses to help inform management and assist in developing programs and policies that will maintain and promote Paychex Values.
Intellectual Property
We own or license and use a number of trademarks, trade names, copyrights, service marks, trade secrets, computer programs and software, and other intellectual property rights. Collectively, our intellectual property rights are material to the conduct of our business. Where it is determined to be appropriate, we take measures to protect our intellectual property rights, including, but not limited to, confidentiality/non-disclosure agreements or policies with employees, vendors, and others; license agreements with licensees and licensors of intellectual property; and registration of certain trademarks. We believe that the “Paychex” name, trademark, and logo are of material importance to us.
Seasonality
There is no significant seasonality to our business. However, during our third fiscal quarter, which ends in February, the number of new payroll clients, new retirement services clients, and new worksite employees associated with our ASO and PEO businesses tends to be higher than during the rest of the fiscal year, primarily because many businesses prefer to start using our services at the beginning of a calendar year. In addition, calendar year-end transaction processing and client funds activity are traditionally higher during our third fiscal quarter due to year-end bonus payments, additional year-end services, and the preparation and delivery of end-of year reporting requirements.
Available Information
We are subject to the informational and reporting requirements of the Securities Exchange Act of 1934, as amended (the “Exchange Act”). Therefore, we file periodic reports, proxy statements, and other information with the SEC. The SEC maintains a website (www.sec.gov) that includes our reports, proxy statements, and other information.
Our corporate website, www.paychex.com, provides materials for investors and information about our services. Our Annual Reports on Form 10-K, Quarterly Reports on Form 10-Q, Current Reports on Form 8-K, and other SEC filings, as well as any amendments to such reports filed or furnished pursuant to Section 13(a) or 15(d) of the Exchange Act, are made available, free of charge, on our website as soon as reasonably practicable after such reports have been filed with or furnished to the SEC. The information on our website is not incorporated by reference into our Form 10-K. Also, copies of our Annual Report to Stockholders and Proxy Statement, to be issued in connection with our 2023 Annual Meeting of Stockholders, will be made available, free of charge, upon written request submitted to Paychex, Inc., c/o Corporate Secretary, 911 Panorama Trail South, Rochester, New York 14625-2396.
10
Item 1A. Risk Factors
Our future results of operations are subject to risks and uncertainties that could cause actual results to differ materially from historical and current results, and from our projections. The following risk factors represent our current view of some of the most important risks facing our business and are important to understanding our business. These are not the only risks we face. Additional factors not presently known to us or that we currently deem to be immaterial also may adversely affect, possibly to a material extent, our business, cash flows, financial condition, or results of operations in future periods. In addition, refer to the cautionary note regarding forward-looking statements at the beginning of Part I of this Form 10-K.
Business and Operational Risks
We may not be able to keep pace with changes in technology or provide timely enhancements to our solutions and support.
The market for our solutions is characterized by rapid technological advancements, changes in customer requirements, frequent new product introductions and enhancements, and changing industry standards. To maintain our growth strategy, we must adapt and respond to technological advances and technological requirements of our clients. Our future success will depend on our ability to: enhance our current solutions and introduce new solutions in order to keep pace with solutions offered by our competitors, including the successful utilization of artificial intelligence and machine learning solutions; enhance capabilities and increase the performance of our internal systems, particularly our systems that meet our clients’ requirements; and adapt to technological advancements and changing industry standards. We continue to make significant investments related to the development of new technology. If our systems become outdated, it may negatively impact our ability to meet performance expectations related to quality, time to market, cost and innovation relative to our competitors. The failure to provide a more efficient and user-friendly customer-facing digital experience across internet and mobile platforms as well as in physical locations may adversely impact our business and operating results. There can be no assurance that our efforts to update and integrate systems will be successful. If we do not integrate and update our systems in a timely manner, or if our investments in technology fail to provide the expected results, there could be a material adverse effect to our business and results of operations. The failure to continually develop enhancements and use of technologies such as robotics and other workflow automation tools, natural language processing, and artificial intelligence/machine learning may impact our ability to increase the efficiency of and reduce costs associated with operational risk management and compliance activities.
We may experience software defects, undetected errors, and development delays, which could damage our relationship with clients, decrease our potential profitability and expose us to liability.
Our solutions rely on software and computing systems that can encounter development delays, and the underlying software may contain undetected errors, viruses or defects. Defects in our solutions and errors or delays caused by our solutions could result in additional development costs, diversion of technical and other resources from our other development efforts, loss of credibility with current or potential clients, harm to our reputation and exposure to liability. In addition, we rely on technologies and software supplied by third parties that may also contain undetected errors, viruses or defects that could have a material adverse effect on our business, financial condition, results of operations and cash flows.
We could be subject to reduced revenues, increased costs, liability claims, or harm to our competitive position as a result of cyberattacks, security vulnerabilities or Internet disruptions.
We rely upon information technology (“IT”) networks, cloud-based platforms, and systems to process, transmit, and store electronic information, and to support a variety of business processes, some of which are provided by third-party vendors. Cyberattacks and security threats are a risk to our business and reputation. A cyberattack, unauthorized intrusion, malicious software infiltration, network disruption or outage, corruption of data, or theft of personal or other sensitive information, could have a material adverse effect on our business operations or that of our clients, result in liability or regulatory sanction, or cause harm to our business and reputation and result in a loss in confidence in our ability to serve clients all of which could have a material adverse effect on our business. The rapid speed of disruptive innovations involving cyberattacks, security vulnerabilities and Internet disruptions enabled by new and emerging technologies may outpace our organization's ability to compete and/or manage the risk appropriately. In addition, cybercriminals may seek to engage in payment-related fraud or by more frequently attempting to gain access to our systems through phishing or other means. Furthermore, security industry experts and government officials have warned about the risks of hackers and cyberattacks targeting IT products and businesses. Because techniques used to obtain unauthorized access or sabotage systems change frequently and often are not recognized until launched against a target, we may be unable to anticipate these techniques or to implement adequate preventative measures.
11
Data Security and Privacy Leaks: We collect, use, and retain increasingly large amounts of personal information about our clients, employees of our clients, and our employees, including: bank account, credit card, and social security numbers, tax return information, health care information, retirement account information, payroll information, system and network passwords, and other sensitive personal and business information. At the same time, the continued occurrence of high-profile cyber and ransomware attacks and data breaches provides evidence of an external environment increasingly hostile to information security. We may be particularly targeted for cyberattack because of the amount and type of personal and business information that we collect, use, and retain. Vulnerabilities, threats, and more sophisticated and targeted computer crimes pose a risk to the security of our systems and networks, and the confidentiality, availability, and integrity of our data. Furthermore, if any of our solutions contains a software vulnerability, the vulnerability may be exploited to obtain access to our data or our clients’ data.
Our service platforms enable our clients to store and process personal data on premises or, increasingly, in a cloud-based environment that we host. The security of our IT infrastructure is an important consideration in our customers’ purchasing decisions. Because the techniques used to obtain unauthorized access, disable or degrade service or sabotage systems change frequently, are increasingly more complex and sophisticated and may be difficult to detect for long periods of time, we may be unable or fail to anticipate these techniques or implement adequate or timely preventative or responsive measures. As cyber threats continue to evolve, we are focused on ensuring that our operating environments safeguard and protect personal and business information. We may be required to invest significant additional resources to comply with evolving cybersecurity regulations and to modify and enhance our information security and controls, and to investigate and remediate any security vulnerabilities. While we have security systems and IT infrastructure in place designed to detect and protect against unauthorized access to such information, if our security measures are breached, either internally or externally, our business could be substantially harmed, and we could incur significant liabilities. Any such breach or unauthorized access could negatively affect our ability to attract new clients, cause existing clients to terminate their agreements with us, result in reputational damage, and subject us to lawsuits, regulatory fines, or other actions or liabilities which could materially and adversely affect our business and operating results. Third-parties, including vendors that provide services for our operations, could also be a source of security risk to us in the event of a failure of their own security systems and infrastructure.
Data Loss and Business Interruption: If our systems are disrupted or fail for any reason, including Internet or systems failure, or if our systems are infiltrated by unauthorized persons, both the Company and our clients could experience data loss, financial loss, harm to reputation, or significant business interruption. Hardware, applications, and services, including cloud-based services, that we develop or procure from third-party vendors may contain defects in design or other problems that could compromise the integrity and availability of our services. Any delays or failures caused by network outages, software or hardware failures, or other data processing disruptions, could result in our inability to provide services in a timely fashion or at all. The speed to closure of significant cybersecurity incidents may be influenced by the cooperation of governmental or law enforcement agencies. We may be required to incur significant costs to protect against damage caused by disruptions or security breaches in the future. Such events may expose us to unexpected liability, litigation, regulatory investigation and penalties, loss of clients’ business, unfavorable impact to business reputation, and there could be a material adverse effect on our business and results of operations.
In the event of a catastrophe, our business continuity plan may fail, which could result in the loss of client data and adversely interrupt operations.
Our operations are dependent on our ability to protect our infrastructure against damage from catastrophe or natural disaster, unauthorized security breach, power loss, telecommunications failure, terrorist attack or act of war, public health emergency, pandemic, or other events that could have a significant disruptive effect on our operations. Climate-related weather disasters, including hurricanes, flooding, snowstorms, and severe rainstorms, could also threaten the business continuity of our operations. We have a business continuity plan in place in the event of system failure due to any of these events. Our business continuity plan has been tested in the past by circumstances of severe weather, including hurricanes, floods, snowstorms, and rainstorms and has been successful. However, these past successes are not an indicator of success in the future. If the business continuity plan is unsuccessful in a disaster recovery scenario, we could potentially lose client data or experience material adverse interruptions to our operations or delivery of services to our clients.
We may be adversely impacted by any failure of third-party service providers to perform their functions.
As part of providing services to clients, we rely on a number of third-party service providers. Service providers include, but are not limited to, couriers used to deliver client payroll checks, banks used to electronically transfer funds from clients to their employees, and information technology vendors servicing cloud-based platforms. Failure by these service providers, for any reason, to deliver their services in a timely manner and in compliance with applicable laws and regulations could result in material interruptions to our operations, impact client relations, and result in significant penalties or liabilities to us.
12
We may be exposed to additional risks related to our co-employment relationship within our PEO business.
Many federal and state laws that apply to the employer-employee relationship do not specifically address the obligations and responsibilities of the “co-employment” relationship within our PEO business. State and federal positions regarding co-employment relationships are in a constant state of flux and change with varying degrees of impact on our operations. We cannot predict when changes will occur or forecast whether any future changes will be favorable or unfavorable to our operations. There is a possibility that we may be subject to liability for violations of employment or discrimination laws by our clients and acts or omissions of client employees, who may be deemed to be our agents, even if we do not participate in any such acts or violations. Although our agreements with clients provide that they will indemnify us for any liability attributable to their own or their employees’ conduct, we may not be able to effectively enforce or collect such contractual obligations. In addition, we could be subject to liabilities with respect to our employee benefit plans if it were determined that we are not the “employer” under any applicable state or federal laws. Incurring additional liabilities related to our PEO business may adversely affect our results of operations.
We may be adversely impacted by changes in health insurance and workers’ compensation rates and underlying claims trends.
Within our PEO business, we maintain health and workers’ compensation insurance covering worksite employees. The insurance costs are impacted by claims experience and are a significant portion of our PEO costs. If we experience a sudden or unexpected increase in claims activity, our costs could increase. In addition, in the event of expiration or cancellation of existing contracts, we may not be able to secure replacement contracts on competitive terms, if at all. Also, as a co-employer in the PEO, we assume or share many of the employer-related responsibilities associated with health care reform, which may result in increased costs. Increases in costs not incorporated into service fees timely or fully could have a material adverse effect on our results of operations. Incorporating cost increases into service fees could also impact our ability to attract and retain clients.
We made and may continue to make acquisitions that involve numerous risks and uncertainties.
Acquisitions subject us to risks, including increased debt, assumption of unforeseen liabilities, and difficulties in integrating operations. Successful integration involves many challenges, including the difficulty of developing and marketing new solutions and support, our exposure to unforeseen liabilities of acquired companies, and the loss of key employees of an acquired business. The integration and conversion of our acquired operations or other future acquisitions, if any, could result in increased operating costs if the anticipated synergies of operating these businesses as one are not achieved, a loss of strategic opportunities if management is distracted by the integration process, and a loss of customers if our service levels drop during or following the integration process. In addition, an acquisition could adversely impact cash flows and/or operating results, and dilute stockholder interests, for many reasons, including charges to our income to reflect the impairment of acquired intangible assets including goodwill, interest costs and debt service requirements for any debt incurred in connection with an acquisition, and any issuance of securities in connection with an acquisition or new business venture that dilutes or lessens the rights of our current stockholders. If the integration of any or all of our acquisitions or future acquisitions is not successful, it could have a material adverse impact on our operating results and stock price.
Financial Risks
Our clients could have insufficient funds to cover payments we made on their behalf, resulting in financial loss to us.
As part of our payroll processing service, we are authorized by our clients to transfer money from their accounts to fund amounts owed to their employees and various taxing authorities. It is possible that we could be held liable for such amounts in the event the client has insufficient funds to cover them. We have in the past, and may in the future, make payments on our clients’ behalf for which we may not be reimbursed, resulting in loss to us. If a significant number of our clients are unable to cover payments we make on their behalf, our results of operations will be materially adversely impacted.
Our interest earned on funds held for clients may be impacted by changes in government regulations mandating the amount of tax withheld or timing of remittance.
We receive interest income from investing client funds collected but not yet remitted to applicable tax or regulatory agencies or to client employees. A change in regulations either decreasing the amount of taxes to be withheld or allowing less time to remit taxes to applicable tax or regulatory agencies could adversely impact interest income.
13
Certain of our debt agreements contain covenants that may constrain the operation of our business, and our failure to comply with these covenants could have a material adverse effect on our financial condition.
The Note Purchase and Guarantee Agreement (the “Agreement”) that we entered into in January 2019 in connection with our acquisition of Oasis Outsourcing Group Holdings, L.P., contains covenants which may restrict our flexibility to operate our business. These covenants include restrictions regarding the incurrence of liens and indebtedness, substantial changes in the general nature of our business and our subsidiaries (taken as a whole), certain merger transactions, certain sales of assets and other matters, all subject to certain exceptions. The Agreement also contains financial covenants, which are reviewed for compliance on a quarterly basis, that require us not to exceed a maximum leverage ratio of 3.5:1.0 and a minimum interest coverage ratio of 2.0:1.0. In addition, certain of our indebtedness may not exceed 20% of our consolidated stockholders’ equity. If we do not comply with these covenants, it could result in material adverse effects on our operating results and our financial condition.
Legal, Regulatory and Political Risks
Our business, services, and financial condition may be adversely impacted by changes in government regulations and policies.
Many of our services, particularly payroll tax administration services, employee benefit plan administration services, and PEO services are designed according to government regulations that often change. Changes in regulations could affect the extent and type of benefits employers are required, or may choose, to provide employees or the amount and type of taxes employers and employees are required to pay. Such changes could reduce or eliminate the need for some of our services and substantially decrease our revenue. The addition of complex added requirements could also increase our cost of doing business.
Our business and reputation may be adversely impacted if we fail to comply with U.S. and foreign laws and regulations.
Our services are subject to various laws and regulations, including, but not limited to, the SECURE Act 2.0, data privacy regulations, and anti-money laundering rules. The growth of our international operations also subjects us to additional risks, such as compliance with foreign laws and regulations. The enactment of new laws and regulations, modifications of existing laws and regulations, or the adverse application or interpretation of new or existing laws or regulations can adversely affect our business. Failure to update our services to comply with modified or new legislation in the areas of payment networks, health care reform and retirement plans as well as failure to educate and assist our clients regarding this legislation could adversely impact our business reputation and negatively impact our client base. Failure to comply with anti-money laundering laws and regulations, which require us to develop and implement risk-based anti-money laundering programs, and maintain transaction records, could result in civil and criminal penalties and adversely impact our business reputation.
We are required to comply with regulations administered by multi-national bodies and governmental agencies worldwide including, but not limited to, the economic sanctions and embargo programs administered by the Office of Foreign Assets Control (“OFAC”), and the Foreign Corrupt Practices Act (“FCPA”). OFAC places restrictions on the sale or export of certain products and services to certain countries and persons. A violation of a sanction or embargo program, or of the FCPA, or similar laws prohibiting certain payments to governmental officials, could subject us, and individual employees, to a regulatory enforcement action as well as significant civil and criminal penalties which could adversely impact our business and operations.
Our reputation, results of operations, or financial condition may be adversely impacted if we fail to comply with data privacy laws and regulations.
Our solutions require the storage and transmission of proprietary and confidential information of our clients and their employees, including personal or identifying information, as well as geolocation and biometric data. Certain solutions are enhanced with the use of artificial intelligence and machine learning. Our solutions are subject to various complex government laws and regulations on the federal, state, and local levels, including those governing personal privacy, as well as ethical considerations. In the U.S., we are subject to rules and regulations promulgated under the authority of the Federal Trade Commission, the Health Insurance Portability and Accountability Act of 1996, the Family Medical Leave Act of 1993, the ACA, federal and state labor and employment laws, and state data breach notification and data privacy laws, such as the California Consumer Privacy Act, as amended. Our European operations are subject to the European Union’s General Data Privacy Regulation. Failure to comply with such laws and regulations could result in the imposition of consent orders or civil and criminal penalties, including fines, which could damage our reputation and have an adverse effect on our results of operations or financial condition. We could be subject to litigation or reputational risk if we or our third-party providers fail to utilize data practices sufficient to safeguard proprietary, confidential, and personal or identifying information. The regulatory
14
framework for privacy issues is rapidly evolving and future enactment of more restrictive laws, rules, or regulations and/or future enforcement actions or investigations could have a materially adverse impact on us through increased costs or restrictions on our business and noncompliance could result in regulatory penalties and significant legal liability.
Failure to protect our intellectual property rights may harm our competitive position and litigation to protect our intellectual property rights or defend against third-party allegations of infringement may be costly.
Despite our efforts to protect our intellectual property and proprietary information, we may be unable to do so effectively in all cases. Our intellectual property could be wrongfully acquired as a result of a cyberattack or other wrongful conduct by employees or third-parties. To the extent that our intellectual property is not protected effectively by trademarks, copyrights, patents, or other means, other parties with knowledge of our intellectual property, including former employees, may seek to exploit our intellectual property for their own and others’ advantage. Competitors may also misappropriate our trademarks, copyrights or other intellectual property rights or duplicate our technology and solutions. Any significant impairment or misappropriation of our intellectual property or proprietary information could harm our business and our brand and may adversely affect our ability to compete. Third parties may claim that we are infringing on their intellectual property rights. To the extent we seek to enforce or must defend our intellectual property rights with litigation, we could incur significant expenses and/or be required to pay substantial damages. We may also be obligated to indemnify our customers or vendors in connection with claims or litigation. The litigation to enforce or defend our intellectual property rights could be costly and time-consuming.
We are involved in litigation from time to time arising from the operation of our business and, as such, we could incur substantial judgments, fines, legal fees, or other costs.
We are sometimes the subject of complaints or litigation from customers, employees, or other third-parties for various actions. From time to time, we are involved in litigation involving claims related to, among other things, breach of contract, tortious conduct, and employment and labor law matters. The damages sought against us in some of these litigation proceedings could be substantial. Although we maintain liability insurance for some litigation claims, if one or more of the claims were to greatly exceed our insurance coverage limits or if our insurance policies do not cover a claim, this could have a material adverse effect on our business, financial condition, results of operations, and cash flows.
General Risk Factors
Our business, results of operations, and financial condition may be impacted by macroeconomic and/or political factors of the U.S. and global economy and such impact could be materially adverse.
We and our clients are subject to the impacts related to inflationary pressure, the recent instability of the banking environment, and other macroeconomic and/or political events. Banking volatility may subject us and our clients to losses on uninsured funds and may make equity or debt financing more difficult to obtain, and additional equity or debt financing might not be available on reasonable terms, if at all. Additionally, our business is substantially dependent on our clients’ continued use of our solutions and support, and our results of operations will decline if our clients are no longer willing or able to use them. Our clients are sensitive to negative changes in economic conditions. If they cease operations or file for bankruptcy protection, we may not be paid for services we already provided, and our client base will shrink, which will lower our revenue. If under financial pressure, our clients may determine that they are no longer willing to pay for the solutions and support we provide, which would reduce our revenue. Our clients may decrease their workforce, which would decrease their demand for our services. Because of spending constraints on our clients and competition in the industry, we may face pricing pressure on our services and challenges in onboarding new clients, which would reduce revenue and ultimately impact our results of operations. Furthermore, if the third-party service providers we rely on are unable to perform their services for us and our clients, our operations could be materially disrupted, and we could face significant penalties or liabilities.
We may be adversely impacted by volatility in the political and economic environment.
Trade, monetary and fiscal policies, and political and economic conditions may substantially change, and credit markets may experience periods of constriction and variability. Additionally, instability in the banking environment may adversely affect our business. These conditions may impact our business due to lower transaction volumes or an increase in the number of clients going out of business. Further, rising inflation may negatively impact our business, raise costs and reduce profitability. Current or potential clients may decide to reduce their spending on payroll and other outsourcing services. In addition, new business formation may be affected by an inability to obtain credit.
15
We invest our funds held for clients in high quality, investment-grade marketable available-for-sale (“AFS”) securities, money markets, and other cash equivalents. We also invest our corporate funds in short- to intermediate-term instruments. Funds held for clients and corporate investments are subject to general market, interest rate, credit, and liquidity risks. These risks may be exacerbated during periods of unusual financial market volatility and inflationary pressure. The interest we earn on funds held for clients and corporate investments may decrease as a result of a decline in funds available to invest or lower interest rates. In addition, during periods of volatility in the credit markets, certain types of investments may not be available to us or may become too risky for us to invest in, further reducing the interest we may earn on client funds. If we are unable to reinvest our AFS securities when they mature, our interest income earned and investment portfolio would be reduced. If we sell AFS securities to satisfy short-term funding requirements, we may recognize losses, which would further reduce the interest income earned on funds held for clients and corporate investments.
Constriction in the credit markets may impact the availability of financing, even to borrowers with the highest credit ratings. Historically, we have periodically borrowed against available credit arrangements to meet short-term liquidity needs. However, should we require additional short-term liquidity during days of large outflows of client funds, a credit constriction may limit our ability to access those funds or the flexibility to obtain them at interest rates that would be acceptable to us. Growth in services for funding payrolls of our clients in the temporary staffing industry may be constricted if access to financing becomes limited. In addition, our ability to grow through significant acquisitions may be limited. See also “Item 7A. Quantitative and Qualitative Disclosures About Market Risk.” If all of these financial and economic circumstances were to remain in effect for an extended period of time, there could be a material adverse effect on our results of operations and financial condition.
We may not be able to attract and retain qualified people, which could impact the quality of our services and customer satisfaction.
Our success, growth, and financial results depend in part on our continuing ability to attract, retain, and motivate highly qualified and diverse personnel at all levels, including management, technical, compliance, and sales personnel. Competition for these individuals can be intense, and we may not be able to retain our key people, or attract, assimilate, or retain other highly-qualified individuals in the future, which could harm our future success.
In the event we receive negative publicity, our reputation and the value of our brand could be harmed, and clients may not use our solutions and support, which may have a material adverse effect on our business.
We are committed to good corporate citizenship, which is reflected in our company culture and core values. Disclosure of our corporate governance practices including our ESG initiatives, may draw negative publicity from stakeholders.
Negative publicity relating to events or activities attributed to us, our policies, our corporate employees, or others associated with us, whether or not justified, may tarnish our reputation and reduce the value of our brand. If we are unable to maintain quality HCM and employee benefit-related solutions and PEO and insurance solutions, our reputation with our clients may be harmed and the value of our brand may diminish. In addition, if our brand is negatively impacted, it may have a material adverse effect on our business, including challenges retaining clients or attracting new clients and recruiting talent and retaining employees.
Item 1B. Unresolved Staff Comments
None.
16
Item 2. Properties
We owned and leased the following properties as of May 31, 2023:
|
|
Square feet |
|
|
Owned facilities: |
|
|
|
|
Rochester, New York |
|
|
832,000 |
|
Other U.S. locations |
|
|
30,000 |
|
Total owned facilities |
|
|
862,000 |
|
|
|
|
|
|
Leased facilities: |
|
|
|
|
Rochester, New York |
|
|
90,000 |
|
Other U.S. locations |
|
|
957,000 |
|
International locations |
|
|
144,000 |
|
Total leased facilities |
|
|
1,191,000 |
|
Our facilities in Rochester, New York house various distribution, processing, and technology functions, certain ancillary functions, a telemarketing unit, and other back-office functions. Facilities outside of Rochester, New York are in various locations throughout the U.S. and house our service centers, fulfillment centers and sales functions. Our international locations primarily house our European operations in Denmark and Germany and a location in India houses information technology, service, and sales support functions.
Item 3. Legal Proceedings
We are subject to various claims and legal matters that arise in the normal course of our business. Refer to Note P of the Notes to Consolidated Financial Statements contained in Item 8 of this Form 10-K for further discussion of our legal proceedings, if any.
Item 4. Mine Safety Disclosures
Not applicable.
17
PART II
Item 5. Market for Registrant’s Common Equity, Related Stockholder Matters and Issuer Purchases of Equity Securities
Our common stock trades on the NASDAQ Global Select Market under the symbol “PAYX”. Dividends have historically been paid on our common stock in August, November, February, and May. The level and continuation of future dividends are dependent on our future earnings and cash flows and are subject to the discretion of our Board of Directors (the “Board”).
As of June 30, 2023, there were 8,698 holders of record of our common stock, which includes registered holders and participants in the Paychex, Inc. Dividend Reinvestment and Stock Purchase Plan. There were also 3,317 participants in the Paychex, Inc. Qualified Employee Stock Purchase Plan and 4,032 participants in the Paychex, Inc. Employee Stock Ownership Plan.
In July 2021, our Board approved a program to repurchase up to $400.0 million of our common stock with authorization that expires on January 31, 2024. The purpose of this program is to manage common stock dilution. There were no shares repurchased during fiscal 2023 and $327.1 million remains available for share repurchases in total under the program.
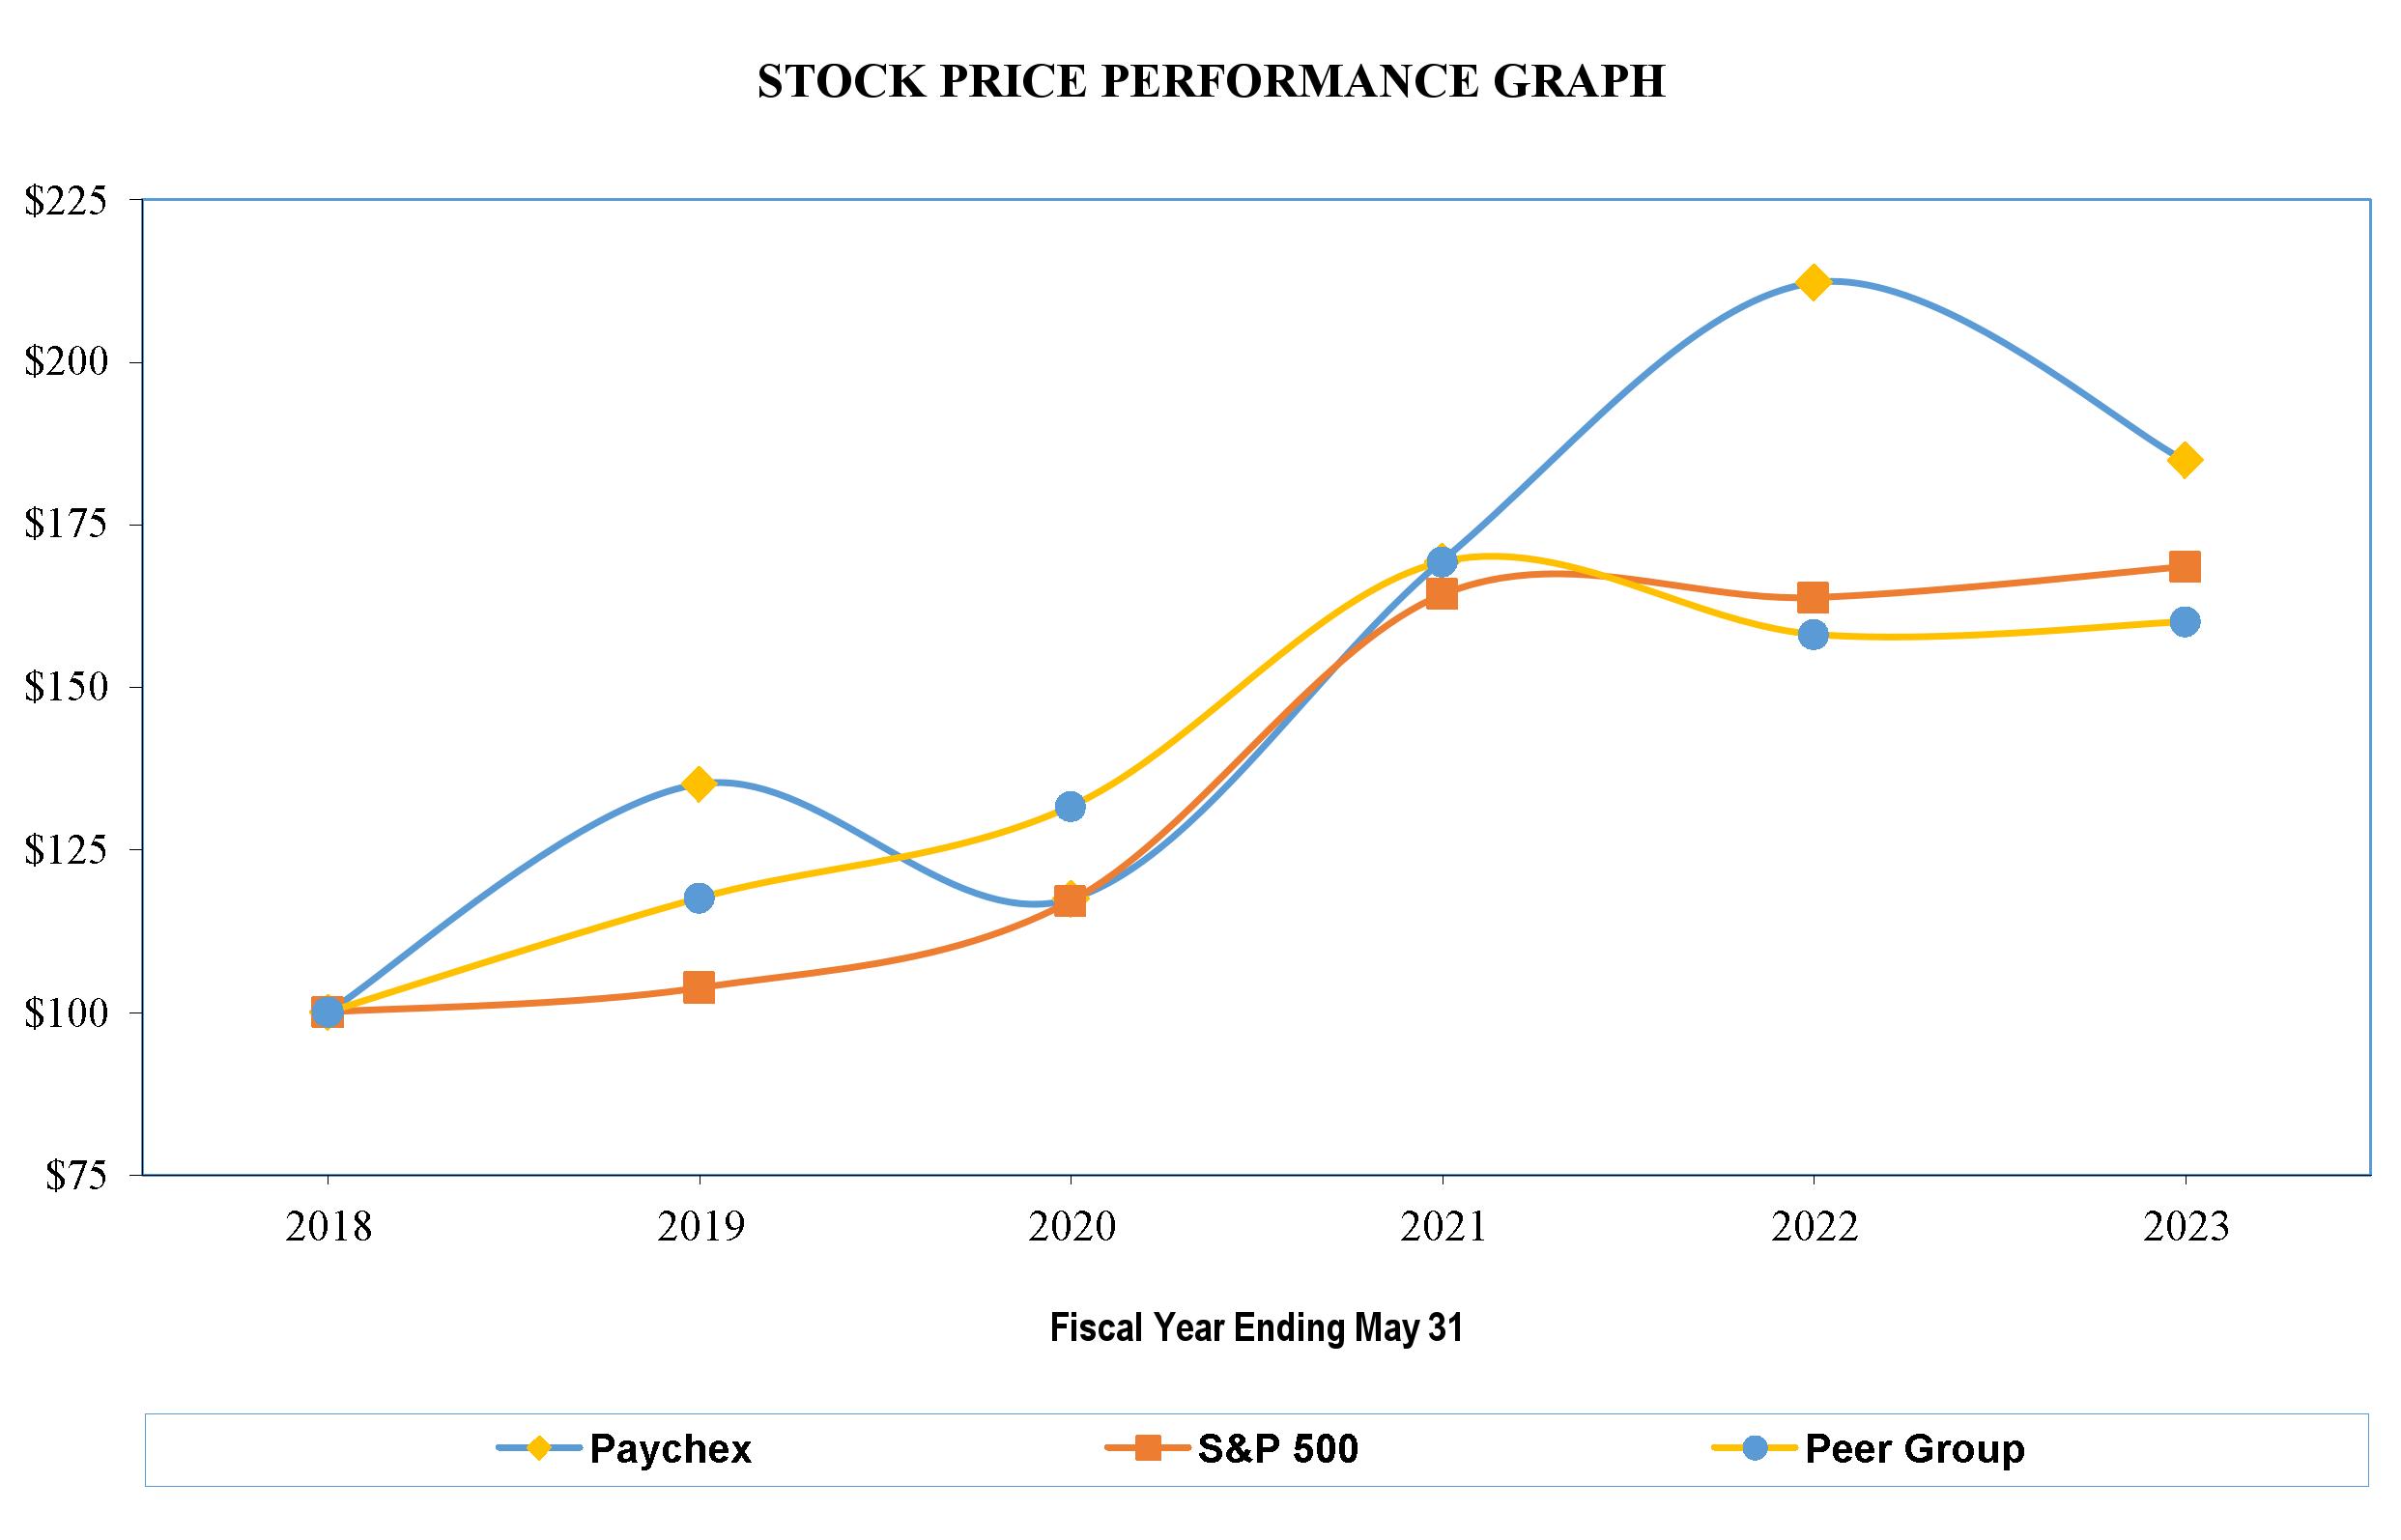
The following graph shows a five-year comparison of the total cumulative returns of investing $100 on May 31, 2018, in Paychex common stock, the S&P 500 Index, and a Peer Group Index. All comparisons of stock price performance shown assume reinvestment of dividends. We are a participant in the S&P 500 Index, a market group of companies with a larger than average market capitalization. Our Peer Group is a group of companies with comparable revenue and net income, who are in a comparable industry, or who are direct competitors of Paychex (as detailed below).
May 31, |
|
2018 |
|
|
2019 |
|
|
2020 |
|
|
2021 |
|
|
2022 |
|
|
2023 |
|
||||||
Paychex |
|
$ |
100.00 |
|
|
$ |
135.05 |
|
|
$ |
117.46 |
|
|
$ |
169.33 |
|
|
$ |
212.24 |
|
|
$ |
184.89 |
|
S&P 500 |
|
$ |
100.00 |
|
|
$ |
103.77 |
|
|
$ |
117.08 |
|
|
$ |
164.26 |
|
|
$ |
163.75 |
|
|
$ |
168.48 |
|
Peer Group |
|
$ |
100.00 |
|
|
$ |
117.55 |
|
|
$ |
131.60 |
|
|
$ |
169.26 |
|
|
$ |
158.04 |
|
|
$ |
160.00 |
|
18
There can be no assurance that our stock performance will continue with the same or similar trends depicted in the graph above. We neither make nor endorse any predictions as to future stock performance.
The Compensation and Leadership Committee of our Board annually reviews and approves the selection of Peer Group companies, adjusting the group from year to year based upon our business and changes in the Peer Group companies’ business or the comparability of their metrics. The Peer Group may also be adjusted in the event of mergers, acquisitions, or other significant economic changes. The Peer Group was not adjusted for fiscal 2023.
Our Peer Group for fiscal 2023 is comprised of the following companies:
Automatic Data Processing, Inc. (direct competitor) |
|
Global Payments Inc. |
Bread Financial Holdings, Inc. |
|
H&R Block, Inc. |
Broadridge Financial Solutions, Inc. |
|
Intuit Inc. |
Equifax, Inc. |
|
Moody's Corporation |
Fiserv, Inc. |
|
TransUnion |
FleetCor Technologies, Inc. |
|
Verisk Analytics, Inc. |
Gartner, Inc. |
|
The Western Union Company |
.
Item 6. [Reserved]
19
Item 7. Management’s Discussion and Analysis of Financial Condition and Results of Operations
Management’s Discussion and Analysis of Financial Condition and Results of Operations reviews the operating results of Paychex, Inc. and its wholly owned subsidiaries (“Paychex,” the “Company,” “we,” “our,” or “us”) for our fiscal year ended May 31, 2023 (“fiscal 2023” or the “fiscal year”), as compared to our fiscal year ended May 31, 2022 (“fiscal 2022”), and our financial condition as of May 31, 2023. A detailed review of our fiscal 2022 performance compared to our fiscal year ended May 31, 2021 performance and our financial condition as of May 31, 2022 is set forth in Part II, Item 7 of our Annual Report on Form 10-K (“Form 10-K”) for fiscal 2022. This review should be read in conjunction with the accompanying consolidated financial statements and the related Notes to Consolidated Financial Statements contained in Item 8 of this Form 10-K and the “Risk Factors” discussed in Item 1A of this Form 10-K. Forward-looking statements in this review are qualified by the cautionary statement under the heading “Cautionary Note Regarding Forward-Looking Statements” contained at the beginning of Part I of this Form 10-K.
Overview
We are a leading provider of integrated human capital management (“HCM”) solutions for human resources (“HR”), payroll, benefits, and insurance for small- to medium-sized businesses and their employees across the United States (“U.S.”) and parts of Europe. We offer a comprehensive portfolio of HCM technology and HR advisory solutions that help our clients address the evolving challenges of HR.
We support our small-business clients, reducing the complexity and risk of running their own payroll, while ensuring greater accuracy with up-to-date tax rates and regulatory information. Clients may choose to have our support team handle everything for them, or process payroll themselves utilizing our proprietary, robust Paychex Flex® and SurePayroll® SaaS-based solutions. Our medium-sized clients generally have more complex payroll and employee benefit needs, though with the environment of increasing regulations, we believe the need for HR outsourcing services has been moving down-market. Any of our clients on Paychex Flex can opt for the integrated suite of HCM solutions, which allows clients to choose the service and software solutions that will meet the needs of their business.
Our portfolio of technology, HR advisory, and employee benefits-related solutions is disaggregated into two categories, (1) Management Solutions and (2) professional employer organization (“PEO”) and Insurance Solutions, as discussed in Part I, Item 1 of this Form 10-K.
Our mission is to be the leading provider of HR, payroll, benefits, and insurance solutions by being an essential partner to small- and medium-sized businesses across the U.S. and parts of Europe. Our strategy focuses on providing industry-leading, integrated technology; delivering superior customer experiences; expanding our leadership in HR; growing our client bases; and engaging in strategic acquisitions. We believe that successfully executing this strategy will lead to strong, long-term financial performance.
We maintain industry-leading margins by managing our personnel costs and expenses while continuing to invest in our business, particularly in sales and marketing and leading-edge technology. We believe these investments are critical to our success. Looking to the future, we believe that investing in our solutions, people, and digital capabilities will position us to capitalize on opportunities for long-term growth.
We closely monitor the evolving challenges and needs of small- and mid-sized businesses, and proactively aid our clients in navigating these challenges. Through our unique blend of innovative technology solutions, backed by our extensive compliance and HR expertise, we help clients more effectively hire, engage, train, and retain top talent in this challenging workforce environment. Our ongoing investments in our platforms have prepared us well for the demands of the current business and regulatory environments, allowing us to adapt while maintaining strong solutions and support delivery, resulting in high levels of client satisfaction and retention.
20
Fiscal 2023 Business Highlights
Highlights compared to fiscal 2022 are as follows:
|
|
Fiscal Year |
|
|
|
|
|
||||||||
In millions, except per share amounts |
|
2023 |
|
|
2022 |
|
|
Change(3) |
|||||||
Total service revenue |
|
$ |
|
4,907.3 |
|
|
$ |
|
4,554.0 |
|
|
|
8 |
|
% |
Total revenue |
|
$ |
|
5,007.1 |
|
|
$ |
|
4,611.7 |
|
|
|
9 |
|
% |
Operating income |
|
$ |
|
2,033.1 |
|
|
$ |
|
1,840.0 |
|
|
|
10 |
|
% |
Net income |
|
$ |
|
1,557.3 |
|
|
$ |
|
1,392.8 |
|
|
|
12 |
|
% |
Adjusted net income(1) |
|
$ |
|
1,548.4 |
|
|
$ |
|
1,367.8 |
|
|
|
13 |
|
% |
Diluted earnings per share |
|
$ |
|
4.30 |
|
|
$ |
|
3.84 |
|
|
|
12 |
|
% |
Adjusted diluted earnings per share(1) |
|
$ |
|
4.27 |
|
|
$ |
|
3.77 |
|
|
|
13 |
|
% |
Dividends paid to stockholders(2) |
|
$ |
|
1,175.0 |
|
|
$ |
|
999.6 |
|
|
|
18 |
|
% |
For further analysis of our results of operations for fiscal years 2023 and 2022, and our financial position as of May 31, 2023, refer to the tables and analysis in the “Results of Operations” and “Liquidity and Capital Resources” sections of this Item 7.
Business Outlook
Our payroll and PEO client base was approximately 740,000 and greater than 730,000 clients as of May 31, 2023 and 2022, respectively. Client retention remained high in the range of 82% to 83% of our beginning client base for fiscal 2023, compared to approximately 84% for fiscal 2022.
While our HR solution offerings provide services to employers and employees beyond payroll, they effectively leverage payroll processing data. These services are included as part of the integrated HCM solution within Paychex Flex or provided through the PEO platform. The following table illustrates selected HR solution offerings:
As of May 31, |
|
2023 |
|
|
2022 |
|
|
Change(1) |
|||||||
Paychex HR Solutions and PEO client worksite employees |
|
|
|
2,168,000 |
|
|
|
|
1,977,000 |
|
|
|
10 |
|
% |
Paychex HR Solutions and PEO clients |
|
|
|
71,000 |
|
|
|
|
66,000 |
|
|
|
8 |
|
% |
Health and benefits services applicants |
|
|
|
203,000 |
|
|
|
|
210,000 |
|
|
|
(3 |
) |
% |
Retirement services plans |
|
|
|
113,000 |
|
|
|
|
104,000 |
|
|
|
9 |
|
% |
We continue to make investments in technology a priority as companies look to leverage technology solutions to maintain operations, stay connected to employees, and increase productivity. Our fiscal 2023 technology enhancements to our Paychex Flex platform were designed to improve the client and employee experiences from hiring and onboarding through employee retention.
We have further strengthened our position in the industry by serving as a source of education and information to clients, businesses of all sizes, and other interested parties. We provide free webinars, white papers, and other information on our website (www.paychex.com) to aid existing and prospective clients with the impact of regulatory changes. The Paychex Insurance Agency, Inc. website, www.paychex.com/group-health-insurance, helps small-business owners navigate the area of insurance coverage. Both this website and www.paychex.com/worx have sections dedicated to the topic of health care reform.
21
Results of Operations
Summary of Results of Operations for Fiscal Years:
In millions, except per share amounts |
|
2023 |
|
2022 |
|
Change(1) |
|||||||||||
Revenue: |
|
|
|
|
|
|
|
|
|
|
|
|
|
|
|||
Management Solutions |
|
$ |
|
3,730.5 |
|
|
|
$ |
|
3,442.7 |
|
|
|
|
8 |
|
% |
PEO and Insurance Solutions |
|
|
|
1,176.8 |
|
|
|
|
|
1,111.3 |
|
|
|
|
6 |
|
% |
Total service revenue |
|
|
|
4,907.3 |
|
|
|
|
|
4,554.0 |
|
|
|
|
8 |
|
% |
Interest on funds held for clients |
|
|
|
99.8 |
|
|
|
|
|
57.7 |
|
|
|
|
73 |
|
% |
Total revenue |
|
|
|
5,007.1 |
|
|
|
|
|
4,611.7 |
|
|
|
|
9 |
|
% |
Total expenses |
|
|
|
2,974.0 |
|
|
|
|
|
2,771.7 |
|
|
|
|
7 |
|
% |
Operating income |
|
|
|
2,033.1 |
|
|
|
|
|
1,840.0 |
|
|
|
|
10 |
|
% |
Other income/(expense), net |
|
|
|
15.1 |
|
|
|
|
|
(15.4 |
) |
|
|
n/m |
|
|
|
Income before income taxes |
|
|
|
2,048.2 |
|
|
|
|
|
1,824.6 |
|
|
|
|
12 |
|
% |
Income taxes |
|
|
|
490.9 |
|
|
|
|
|
431.8 |
|
|
|
|
14 |
|
% |
Effective income tax rate |
|
|
|
24.0 |
|
% |
|
|
|
23.7 |
|
% |
|
|
|
|
|
Net income |
|
$ |
|
1,557.3 |
|
|
|
$ |
|
1,392.8 |
|
|
|
|
12 |
|
% |
Diluted earnings per share |
|
$ |
|
4.30 |
|
|
|
$ |
|
3.84 |
|
|
|
|
12 |
|
% |
n/m – not meaningful
The changes in revenue as compared to the prior year period were primarily driven by the following factors:
22
We invest in highly liquid, investment-grade fixed income securities and do not utilize derivative instruments to manage interest rate risk. As of May 31, 2023, we had no exposure to high-risk or non-liquid investments. Details regarding our combined funds held for clients and corporate cash equivalents and investment portfolios are as follows:
|
|
Year ended May 31, |
||||||||||
|
|
|
|
|
|
|
|
|
|
|
||
$ in millions |
|
2023 |
|
2022 |
||||||||
Average investment balances: |
|
|
|
|
|
|
|
|
|
|
||
Funds held for clients |
|
$ |
|
4,392.7 |
|
|
|
$ |
|
4,354.8 |
|
|
Corporate cash equivalents and investments |
|
|
|
1,470.9 |
|
|
|
|
|
1,303.3 |
|
|
Total |
|
$ |
|
5,863.6 |
|
|
|
$ |
|
5,658.1 |
|
|
|
|
|
|
|
|
|
|
|
|
|
||
Average interest rates earned (exclusive of net realized gains/(losses)): |
||||||||||||
Funds held for clients |
|
|
|
2.5 |
|
% |
|
|
|
1.3 |
|
% |
Corporate cash equivalents and investments |
|
|
|
3.3 |
|
% |
|
|
|
0.2 |
|
% |
Combined funds held for clients and corporate cash equivalents and investments |
|
|
|
2.7 |
|
% |
|
|
|
1.1 |
|
% |
|
|
|
|
|
|
|
|
|
|
|
||
Total net realized (losses)/gains |
|
$ |
|
(9.8 |
) |
|
|
$ |
|
0.2 |
|
|
$ in millions |
|
|
|
|
|
|
|
|
|
|
||
As of May 31, |
|
2023 |
|
2022 |
||||||||
Net unrealized losses on available-for-sale ("AFS") securities(1) |
|
$ |
|
(175.3 |
) |
|
|
$ |
|
(136.3 |
) |
|
Federal Funds rate(2) |
|
|
|
5.25 |
|
% |
|
|
|
1.00 |
|
% |
Total fair value of AFS securities |
|
$ |
|
3,604.6 |
|
|
|
$ |
|
4,029.2 |
|
|
Weighted-average duration of AFS securities in years(3) |
|
|
|
3.3 |
|
|
|
|
|
3.2 |
|
|
Weighted-average yield-to-maturity of AFS securities(3) |
|
|
|
2.9 |
|
% |
|
|
|
1.9 |
|
% |
Refer to the “Market Risk Factors” section contained in Item 7A of this Form 10-K for more information on changing interest rates.
Total expenses: The following table summarizes total combined cost of service revenue and selling, general and administrative expenses for fiscal years:
In millions |
|
2023 |
|
|
2022 |
|
|
Change(1) |
|||||||
Compensation-related expenses |
|
$ |
|
1,782.6 |
|
|
$ |
|
1,632.2 |
|
|
|
9 |
|
% |
PEO insurance costs |
|
|
|
416.8 |
|
|
|
|
405.2 |
|
|
|
3 |
|
% |
Depreciation and amortization |
|
|
|
176.6 |
|
|
|
|
191.8 |
|
|
|
(8 |
) |
% |
Other expenses |
|
|
|
598.0 |
|
|
|
|
542.5 |
|
|
|
10 |
|
% |
Total expenses |
|
$ |
|
2,974.0 |
|
|
$ |
|
2,771.7 |
|
|
|
7 |
|
% |
The changes in total expenses as compared to the prior year were primarily driven by the following factors:
23
Operating income: Fiscal 2023 operating income was $2.0 billion, an increase of 10% compared to fiscal 2022, as a result of revenue growth outpacing expense increases as previously discussed. Operating margin (operating income as a percentage of total revenue) was as follows:
|
|
Fiscal Year |
||||||||||
|
|
2023 |
|
2022 |
||||||||
Operating Margin (operating income as a percentage of total revenue) |
|
|
|
40.6 |
|
% |
|
|
|
39.9 |
|
% |
Other income/(expense): Other income/(expense) increased $30.5 million to $15.1 million in fiscal 2023 as a result of higher average interest rates earned on our corporate investments.
Income taxes: Our effective income tax rate was 24.0% and 23.7% for fiscal years 2023 and 2022, respectively. Both periods include the recognition of excess tax benefits related to employee stock-based compensation payments. The prior year was also impacted by the recording of a tax benefit related to prior years' research and development expenses incurred in the production of customer-facing software. Refer to Note K of the Notes to Consolidated Financial Statements contained in Item 8 of this Form 10-K for additional disclosures on income taxes.
Net income and diluted earnings per share: Net income was $1.6 billion and $1.4 billion for fiscal 2023 and fiscal 2022, respectively. Diluted earnings per share was $4.30 per diluted share for fiscal 2023 and $3.84 per diluted share for fiscal 2022. Refer to Note C of the Notes to Consolidated Financial Statements contained in Item 8 of this Form 10-K for information on dilutive shares outstanding.
Adjusted net income(1) was $1.5 billion and $1.4 billion for fiscal 2023 and fiscal 2022, respectively, reflecting an increase of 13%. Adjusted diluted earnings per share(1) was $4.27 per diluted share and $3.77 per diluted share for fiscal 2023 and fiscal 2022, respectively, reflecting an increase of 13%.
24
Non-GAAP Financial Measures: Adjusted net income, adjusted diluted earnings per share, and earnings before interest, taxes, depreciation, and amortization (“EBITDA”) are summarized as follows:
$ in millions |
|
2023 |
|
|
2022 |
|
|
Change(1) |
|||||||
|
|
|
|
|
|
|
|
|
|
|
|
|
|||
Net income |
|
$ |
|
1,557.3 |
|
|
$ |
|
1,392.8 |
|
|
|
12 |
|
% |
Non-GAAP adjustments: |
|
|
|
|
|
|
|
|
|
|
|
|
|||
Excess tax benefit related to employee stock-based compensation payments(2) |
|
|
|
(8.9 |
) |
|
|
|
(18.9 |
) |
|
|
|
|
|
Tax benefit derived from research and development costs (3) |
|
|
|
— |
|
|
|
|
(6.1 |
) |
|
|
|
|
|
Total non-GAAP adjustments |
|
|
|
(8.9 |
) |
|
|
|
(25.0 |
) |
|
|
|
|
|
Adjusted net income |
|
$ |
|
1,548.4 |
|
|
$ |
|
1,367.8 |
|
|
|
13 |
|
% |
|
|
|
|
|
|
|
|
|
|
|
|
|
|||
Diluted earnings per share(4) |
|
$ |
|
4.30 |
|
|
$ |
|
3.84 |
|
|
|
12 |
|
% |
Non-GAAP adjustments: |
|
|
|
|
|
|
|
|
|
|
|
|
|||
Excess tax benefit related to employee stock-based compensation payments(2) |
|
|
|
(0.02 |
) |
|
|
|
(0.05 |
) |
|
|
|
|
|
Tax benefit derived from research and development costs (3) |
|
|
|
— |
|
|
|
|
(0.02 |
) |
|
|
|
|
|
Total non-GAAP adjustments |
|
|
|
(0.02 |
) |
|
|
|
(0.07 |
) |
|
|
|
|
|
Adjusted diluted earnings per share |
|
$ |
|
4.27 |
|
|
$ |
|
3.77 |
|
|
|
13 |
|
% |
|
|
|
|
|
|
|
|
|
|
|
|
|
|||
Net income |
|
$ |
|
1,557.3 |
|
|
$ |
|
1,392.8 |
|
|
|
12 |
|
% |
Non-GAAP adjustments: |
|
|
|
|
|
|
|
|
|
|
|
|
|||
Interest (income)/expense, net |
|
|
|
(12.4 |
) |
|
|
|
33.7 |
|
|
|
|
|
|
Income taxes |
|
|
|
490.9 |
|
|
|
|
431.8 |
|
|
|
|
|
|
Depreciation and amortization expense |
|
|
|
176.6 |
|
|
|
|
191.8 |
|
|
|
|
|
|
Total non-GAAP adjustments |
|
|
|
655.1 |
|
|
|
|
657.3 |
|
|
|
|
|
|
EBITDA |
|
$ |
|
2,212.4 |
|
|
$ |
|
2,050.1 |
|
|
|
8 |
|
% |
In addition to reporting net income and diluted earnings per share, which are U.S. GAAP measures, we present adjusted net income, adjusted diluted earnings per share, and EBITDA, which are non-GAAP measures. We believe these additional measures are indicators of our core business operations performance period over period. Adjusted net income, adjusted diluted earnings per share, and EBITDA, are not calculated through the application of U.S. GAAP and are not required forms of disclosure by the Securities and Exchange Commission (“SEC”). As such, they should not be considered a substitute for the U.S. GAAP measures of net income and diluted earnings per share, and, therefore, they should not be used in isolation but in conjunction with the U.S. GAAP measures. The use of any non-GAAP measure may produce results that vary from the U.S. GAAP measure and may not be comparable to a similarly defined non-GAAP measure used by other companies.
Liquidity and Capital Resources
Our financial position as of May 31, 2023 remained strong with cash, restricted cash, and total corporate investments of $1.6 billion. Total short-term and long-term borrowings, net of debt issuance costs, were $808.4 million as of May 31, 2023. Our primary source of cash is our ongoing operations. Cash flows from operations were $1.7 billion for fiscal 2023. Our positive cash flows for fiscal 2023 allowed us to support our business and pay dividends of approximately $1.2 billion. We currently anticipate that cash, restricted cash, and total corporate investments as of May 31, 2023, along with projected operating cash flows and available short-term financing, will support our business operations, capital purchases, share repurchases, and dividend payments for the foreseeable future.
25
We believe that our investments in an unrealized loss position as of May 31, 2023 were not impaired due to increased credit risk or other valuation concerns, nor has any event occurred subsequent to that date to indicate any change in our assessment.
Financing
Short-term financing: We maintain committed and unsecured credit facilities and irrevocable letters of credit as part of our normal and recurring business operations. The purpose of these credit facilities is to meet short-term funding requirements, finance working capital needs, and for general corporate purposes. We typically borrow on an overnight or short-term basis on our credit facilities. Refer to Note L of the Notes to Consolidated Financial Statements contained in Item 8 of this Form 10-K for further discussion on our credit facilities.
Details of our credit facilities are as follows:
|
|
|
|
Maximum |
|
|
May 31, 2023 |
|
|||||||||
|
|
|
|
Amount |
|
|
Outstanding |
|
|
Available |
|
||||||
$ in millions |
|
Expiration Date |
|
Available |
|
|
Amount |
|
|
Amount |
|
||||||
Credit facilities: |
|
|
|
|
|
|
|
|
|
|
|
|
|
|
|||
JP Morgan Chase Bank, N.A. (“JPM”) |
|
July 31, 2024 |
|
$ |
|
1,000.0 |
|
|
$ |
|
— |
|
|
$ |
|
1,000.0 |
|
JPM |
|
September 17, 2026 |
|
$ |
|
750.0 |
|
|
|
|
— |
|
|
|
|
750.0 |
|
PNC Bank, National Association (“PNC”) |
|
February 6, 2026 |
|
$ |
|
250.0 |
|
|
|
|
10.2 |
|
|
|
|
239.8 |
|
Total Lines of Credit Outstanding and Available |
|
|
|
|
|
|
|
$ |
|
10.2 |
|
|
$ |
|
1,989.8 |
|
|
|
|
|
|
|
|
|
|
|
|
|
|
|
|
|
|||
Amounts outstanding under the PNC credit facility as of May 31, 2023 remain outstanding as of the date of this report.
Details of borrowings under each credit facility during the fiscal years ended 2023 and 2022 were as follows:
|
|
Year ended May 31, 2023 |
||||||||||||||||
|
|
Credit Facility |
||||||||||||||||
|
|
$1 Billion |
|
$750 Million |
|
$250 Million |
||||||||||||
$ in millions |
|
JPM |
|
JPM |
|
PNC |
||||||||||||
Number of days borrowed |
|
|
|
— |
|
|
|
|
|
— |
|
|
|
|
365 |
|
|
|
Maximum amount borrowed |
|
$ |
|
— |
|
|
|
$ |
|
— |
|
|
|
$ |
|
10.6 |
|
|
Weighted-average amount borrowed |
|
$ |
|
— |
|
|
|
$ |
|
— |
|
|
|
$ |
|
10.0 |
|
|
Weighted-average interest rate |
|
|
|
— |
|
% |
|
|
|
— |
|
% |
|
|
|
4.81 |
|
% |
|
|
Year ended May 31, 2022 |
||||||||||||||||
|
|
Credit Facility |
||||||||||||||||
|
|
$1 Billion |
|
$750 Million |
|
$250 Million |
||||||||||||
$ in millions |
|
JPM |
|
JPM |
|
PNC |
||||||||||||
Number of days borrowed |
|
|
|
— |
|
|
|
|
|
— |
|
|
|
|
365 |
|
|
|
Maximum amount borrowed |
|
$ |
|
— |
|
|
|
$ |
|
— |
|
|
|
$ |
|
106.5 |
|
|
Weighted-average amount borrowed |
|
$ |
|
— |
|
|
|
$ |
|
— |
|
|
|
$ |
8.5 |
|
|
|
Weighted-average interest rate |
|
|
|
— |
|
% |
|
|
|
— |
|
% |
|
|
|
1.36 |
|
% |
26
Short-term borrowings are primarily used for the settlement of client fund obligations, rather than liquidating previously collected client funds that have been invested in AFS securities allocated to our long-term portfolio.
On February 3, 2023, we and Paychex Advance LLC, a Paychex subsidiary and New York limited liability company, entered into Amendment No. 2 (the “Amendment”) to the $250 million, three-year, unsecured, revolving credit facility established on February 6, 2020 (the “2020 Credit Facility”) for which PNC Bank, N.A. acts as administrative agent.
The Amendment, among other things, extended the maturity date of the 2020 Credit Facility from February 6, 2023 to February 6, 2026 at which time all borrowings thereunder will terminate. Except for extending the maturity date and making ministerial changes to the 2020 Credit Facility, the Amendment did not change the existing terms of the 2020 Credit Facility.
Subsequent to May 31, 2023, there were no additional overnight borrowings under our PNC and JPM credit facilities.
We expect to have access to the amounts available under our current credit facilities to meet our ongoing financial needs. However, if we experience reductions in our operating cash flows due to any of the risk factors outlined in, but not limited to, Item 1A in this Form 10-K and other SEC filings, we may need to adjust our capital, operating, and other discretionary spending to realign our working capital requirements with the capital resources available to us. Furthermore, if we determine the need for additional short-term liquidity, there is no assurance that such financing, if pursued and obtained, would be adequate or on terms acceptable to us.
Letters of credit: As of May 31, 2023, we had irrevocable standby letters of credit available totaling $141.7 million, required to secure commitments for certain insurance policies. The letters of credit expire at various dates between June 9, 2023 and May 25, 2024. No amounts were outstanding on these letters of credit during fiscal 2023 or fiscal 2022, or as of May 31, 2023 and May 31, 2022. Subsequent to May 31, 2023, letters of credit expiring on June 9, 2023, June 15, 2023, and June 26, 2023 were renewed for one year terms.
Long-term financing: We have borrowed $800.0 million through the issuance of long-term private placement debt (“Senior Notes”). Certain information related to the Senior Notes is as follows:
|
|
Senior Notes |
|
Senior Notes |
|
|
Series A |
|
Series B |
Stated interest rate |
|
4.07% |
|
4.25% |
Effective interest rate |
|
4.14% |
|
4.31% |
Interest rate type |
|
Fixed |
|
Fixed |
Interest payment dates |
|
Semi-annual, in arrears |
|
Semi-annual, in arrears |
Principal payment dates |
|
March 13, 2026 |
|
March 13, 2029 |
Note type |
|
Unsecured |
|
Unsecured |
Refer to Note M of the Notes to Consolidated Financial Statements contained in Item 8 of this Form 10-K for further discussion on our long-term financing.
Other commitments: The Company has various long-term contractual obligations as of May 31, 2023, which include:
Refer to Notes A, H, M, and P of the Notes to Consolidated Financial Statements contained in Item 8 of this Form 10-K for more information on these areas.
The liability for uncertain tax positions, including interest and net of federal benefits, was approximately $69.4 million as of May 31, 2023. Refer to Note K of the Notes to Consolidated Financial Statements contained in Item 8 of this Form 10-K for more information on income taxes. We are not able to reasonably estimate the timing of future cash flows related to this liability.
27
We are a limited partner in three venture capital fund arrangements and have committed to contribute a maximum amount of $30.0 million for investment in equity and debt securities of start-up entities primarily in the financial technology sector. As of May 31, 2023, we have contributed $22.2 million of the total funding commitment. The timing of future contributions to be made to these venture capital funds cannot be specifically or reasonably determined. Our investments in these venture capital funds are not considered part of our ongoing operations, are accounted for under the equity method, and represented less than one percent of our total assets as of May 31, 2023.
In the normal course of business, we make representations and warranties that guarantee the performance of services under service arrangements with clients. Historically, there have been no material losses related to such guarantees. We have also entered into indemnification agreements with our officers and directors, which require us to defend and, if necessary, indemnify these individuals for certain pending or future legal claims as they relate to their services provided to us.
We currently self-insure the deductible portion of various insured exposures under certain corporate and PEO employee health and medical benefit plans. Our estimated loss exposure under these insurance arrangements is recorded in other current liabilities on our Consolidated Balance Sheets. Historically, the amounts accrued have not been material and were not material as of May 31, 2023. We also maintain corporate insurance coverage in addition to our purchased primary insurance policies for gap coverage for employment practices liability, errors and omissions, warranty liability, theft and embezzlement, cyber threats, and acts of terrorism; and capacity for deductibles and self-insured retention through our captive insurance company.
Operating, Investing, and Financing Cash Flow Activities
|
|
Year ended May 31, |
|
||||||||||||
In millions |
|
2023 |
|
|
2022 |
|
|
|
Change |
|
|||||
Net cash provided by operating activities |
|
$ |
|
1,699.4 |
|
|
$ |
|
1,505.5 |
|
|
$ |
|
193.9 |
|
Net cash provided by/(used in) investing activities |
|
|
|
218.5 |
|
|
|
|
(1,420.9 |
) |
|
|
|
1,639.4 |
|
Net cash used in financing activities |
|
|
|
(711.4 |
) |
|
|
|
(979.3 |
) |
|
|
|
267.9 |
|
Net change in cash, restricted cash, and equivalents |
|
$ |
|
1,206.5 |
|
|
$ |
|
(894.7 |
) |
|
$ |
|
2,101.2 |
|
|
|
|
|
|
|
|
|
|
|
|
|
|
|||
Cash dividends per common share |
|
$ |
|
3.26 |
|
|
$ |
|
2.77 |
|
|
|
|
|
|
The changes in our cash flows for fiscal 2023 and fiscal 2022 were primarily the result of the following key drivers:
Operating Cash Flow Activities
Investing Cash Flow Activities
Fluctuations in the net purchases and sales/maturities of AFS securities are also due to timing within the client funds portfolio and market conditions. Specific timing items impacting cash flows for fiscal 2023 and fiscal 2022 are discussed further in the financing cash flows discussion of net changes in client fund obligations. Amounts will vary based upon the timing of collection from clients, and the related remittance to applicable tax or regulatory agencies for payroll tax administration services and to employees of clients utilizing employee payment services.
Discussion of interest rates and related risks is included in the “Market Risk Factors” section contained in Item 7A of this Form 10-K.
28
Financing Cash Flow Activities
The client fund obligations liability will also vary based on the timing of collecting client funds and the related required remittance of funds to applicable tax or regulatory agencies for payroll tax administration services and to employees of clients utilizing employee payment services. Collections from clients are typically remitted from one to 30 days after receipt, with some items extending to 90 days.
Other
Recently issued accounting pronouncements: Refer to Note A of the Notes to Consolidated Financial Statements contained in Item 8 of this Form 10-K for a discussion of recently issued accounting pronouncements.
29
Critical Accounting Policies and Estimates
Note A of the Notes to Consolidated Financial Statements contained in Item 8 of this Form 10-K discusses the significant accounting policies of Paychex. Our discussion and analysis of our financial condition and results of operations are based upon our consolidated financial statements, which have been prepared in accordance with U.S. GAAP. The preparation of these financial statements requires us to make estimates, judgments, and assumptions that affect reported amounts of assets, liabilities, revenue, and expenses. On an ongoing basis, we evaluate the accounting policies and estimates used to prepare the consolidated financial statements. We base our estimates on historical experience, future expectations, and assumptions believed to be reasonable under current facts and circumstances. Actual amounts and results could differ from these estimates. Certain accounting policies that are deemed critical to our results of operations or financial position are discussed below.
Revenue recognition: Revenues are primarily attributable to fees for providing services as well as investment income earned on funds held for clients. Fees associated with services are recognized when control of the contracted services is transferred to our clients, in an amount that reflects the consideration we expect to receive in exchange for such services. Our service revenue is largely attributable to processing services where the fee is based on a fixed amount per processing period or a fixed amount per processing period plus a fee per employee or transaction processed. Insurance Solutions revenues are recognized when commissions are earned on premiums billed and collected. Fees earned for funding payrolls of our clients in the temporary staffing industry via the purchase of accounts receivable are based on a percentage of funding amounts as specified in the client contract. These fees are then recognized over the average collection period of 41 to 44 days. The revenue earned from delivery service for the distribution of certain client payroll checks and reports is included in service revenue, and the costs for the delivery are included in cost of service revenue on the Consolidated Statements of Income and Comprehensive Income.
We receive advance payments for set-up fees from our clients. Advance payments received for certain of our service offerings for set-up fees are considered a material right. Therefore, we defer the revenue associated with these advance payments, recognizing the revenue and related expenses over the expected period to which the material right exists.
PEO Solutions revenue is included in service revenue and is reported net of certain pass-through costs billed and incurred, which include payroll wages, payroll taxes, including federal and state unemployment insurance, and certain health insurance benefit premiums, primarily costs related to our guaranteed cost benefit plans. Direct costs related to workers’ compensation and certain benefit plans where we retain risk are recognized as cost of service revenue rather than as a reduction in service revenue.
Interest on funds held for clients is earned primarily on funds that are collected from clients before due dates for payroll tax administration services and for employee payment services and invested until remittance to the applicable tax or regulatory agencies or client employees. These collections from clients are typically remitted from one to 30 days after receipt, with some items extending to 90 days. The interest earned on these funds is included in total revenue on the Consolidated Statements of Income and Comprehensive Income because the collecting, holding, and remitting of these funds are components of providing these services.
Assets Recognized from the Costs to Obtain and Fulfill Contracts: We recognize an asset for the incremental costs of obtaining a contract with a client if it is expected that the economic benefit and amortization period will be longer than one year. Incremental costs of obtaining a contract include only those costs that are directly related to the acquisition of new contracts and that would not have been incurred if the contract had not been obtained. We do not incur incremental costs to obtain a contract renewal. We determined that certain sales commissions and bonuses, including related fringe benefits, meet the capitalization criteria under Accounting Standards Codification (“ASC”) Subtopic 340-40, “Other Assets and Deferred Costs: Contracts with Customers” (“ASC 340-40”). We also recognize an asset for the costs to fulfill a contract with a client if the costs are specifically identifiable, generate or enhance resources used to satisfy future performance obligations, and are expected to be recovered. We determined that substantially all costs related to implementation activities are administrative in nature and meet the capitalization criteria under ASC 340-40. These capitalized costs to fulfill a contract principally relate to upfront direct costs that are expected to be recovered and enhance our ability to satisfy future performance obligations.
The assets related to both costs to obtain and costs to fulfill contracts with clients are capitalized and amortized using an accelerated method over an eight-year life to closely align with the pattern of client attrition over the estimated life of the client relationship. We regularly review our deferred costs for potential impairment and did not recognize an impairment loss during the fiscal years ended May 31, 2023 or May 31, 2022.
30
PEO insurance reserves: As part of our PEO solution, we offer workers’ compensation insurance and health insurance to clients for the benefit of client employees. Workers’ compensation insurance is primarily provided under fully insured high deductible workers’ compensation insurance policies. Workers’ compensation insurance reserves are established to provide for the estimated costs of paying claims up to per occurrence liability limits. These reserves include estimates of certain expenses associated with processing and settling these claims. In establishing the PEO workers’ compensation insurance reserves, we use an independent actuarial estimate of undiscounted future cash payments that would be made to settle claims. The determination of estimated ultimate losses by our independent actuary are based on accepted actuarial methods and assumptions. The estimated ultimate losses are primarily based upon loss development factors, and other factors such as the nature of employees’ job responsibilities, the historical frequency and severity of workers’ compensation claims, and an estimate of future cost trends. Each reporting period, changes in actuarial assumptions resulting from changes in actual claims experience and other trends are incorporated into our workers’ compensation claims cost estimates.
With respect to our PEO health insurance, we offer various health insurance plans that take the form of either fully insured guaranteed cost plans or fully insured insurance arrangements where we retain risk. A reserve for insurance arrangements where we retain risk is established to provide for the payment of claims in accordance with our service contract with the carrier. The claims liability includes estimates for reported losses, plus amounts for those claims incurred but not reported, and estimates of certain expenses associated with processing and settling the claims.
Estimating the ultimate cost of future claims is an uncertain and complex process based upon historical loss experience and accepted actuarial methods and assumptions, and is subject to change due to multiple factors, including economic trends, changes in legal liability law, and damage awards, all of which could materially impact the reserves as reported in the consolidated financial statements. Accordingly, final claim settlements may vary from the present estimates, particularly with workers’ compensation insurance where those payments may not occur until well into the future. We regularly review the adequacy of our estimated insurance reserves. Adjustments to previously established reserves are reflected in the results of operations for the period in which the adjustment is identified. Such adjustments could possibly be significant, reflecting any combination of new and adverse or favorable trends. Adjustments to previously established reserves were not material for fiscal 2023 or 2022.
Goodwill and other intangible assets: Goodwill is not amortized, but instead is tested for impairment on an annual basis and between annual tests if an event occurs or circumstances change in a way to indicate that there has been a potential decline in the fair value of a reporting unit. We perform our annual impairment testing in our fiscal fourth quarter. During fiscal 2023, a qualitative analysis was performed for all reporting units. During fiscal 2022, a qualitative assessment was performed for our Paychex, Inc., excluding Purchased Receivables, reporting unit, and a quantitative assessment was performed on the Purchased Receivable reporting unit to determine if it is more-likely-than-not that the fair value of the reporting units had declined below their carrying value. The qualitative assessment considered various financial, macroeconomic, industry, and reporting unit specific qualitative factors. Based on the results of our testing, no impairment loss was recognized in the results of operations for fiscal 2023 or 2022. Subsequent to the latest review, there have been no events or circumstances that indicate any potential impairment of the Company’s goodwill balance.
We also test intangible assets with indefinite useful lives for potential impairment on an annual basis and between annual tests if events or changes in circumstances change in a way that indicate that the carrying value may not be recoverable. We have determined that there is no impairment of intangible assets with indefinite useful lives for fiscal 2023 or 2022 as a result of the qualitative analyses performed.
Impairment of Long-Lived Assets: Long-lived assets, including intangible assets with finite lives and operating lease right-of-use (“ROU”) assets, are reviewed for impairment when events or changes in circumstances indicate that the carrying amount of an asset may not be recoverable. Recoverability of assets to be held and used is measured by a comparison of the carrying amount of an asset to estimated undiscounted future cash flows expected to be generated by the asset. If the carrying amount of an asset exceeds its estimated future cash flows, an impairment charge is recognized for the amount by which the carrying amount of the asset exceeds the estimated fair value of the asset. We have determined that there is no impairment of long-lived assets for fiscal 2023 or as of May 31, 2023.
31
Stock-based compensation costs: All stock-based awards to employees are recognized as compensation costs in our consolidated financial statements based on their fair values measured as of the date of grant. We estimate the fair value of stock option grants using a Black-Scholes option pricing model. This model requires various assumptions as inputs including expected volatility of the Paychex stock price and expected option life. Volatility is estimated based on a combination of historical volatility using stock prices over a period equal to the expected option life and implied market volatility. Expected option life is estimated based on historical exercise behavior. We periodically reassess our assumptions as well as our choice of valuation model. We will reconsider use of this model if additional information becomes available in the future indicating that another model would provide a more accurate estimate of fair value, or if characteristics of future grants would warrant such a change.
The fair value of stock awards is determined based on the stock price at the date of grant. For grants that do not accrue dividends or dividend equivalents, the fair value is the stock price reduced by the present value of estimated dividends over the vesting period or performance period.
We estimate forfeitures and only record compensation costs for those awards that are expected to vest. Our assumptions for forfeitures were determined based on type of award and historical experience. Forfeiture assumptions are adjusted at the point in time a significant change is identified, with any adjustment recorded in the period of change, and the final adjustment at the end of the requisite service period to equal actual forfeitures.
The assumptions of volatility, expected option life, and forfeitures all require significant judgment and are subject to change in the future due to factors such as employee exercise behavior, stock price trends, and changes to type or provisions of stock-based awards. Any material change in one or more of these assumptions could have a material impact on the estimated fair value of a future award.
Refer to Note E of the Notes to Consolidated Financial Statements contained in Item 8 of this Form 10-K for further discussion of our stock-based compensation plans.
Income taxes: We account for deferred taxes by recognition of deferred tax assets and liabilities for the expected future tax consequences of events that have been included in the consolidated financial statements or tax returns. Under this method, deferred tax assets and liabilities are determined based on the difference between the financial statement and tax basis of assets and liabilities using enacted tax rates in effect for the fiscal year in which the differences are expected to reverse. We record a deferred tax asset related to the stock-based compensation costs recognized for certain stock-based awards. At the time of the exercise of non-qualified stock options or vesting of stock awards, we recognize any excess tax benefit within income taxes in the Consolidated Statements of Income and Comprehensive Income.
We maintain a reserve for uncertain tax positions. We evaluate tax positions taken or expected to be taken in a tax return for recognition in our consolidated financial statements. Prior to recording the related tax benefit in our consolidated financial statements, we must conclude that tax positions will be more-likely-than-not to be sustained, assuming those positions will be examined by taxing authorities with full knowledge of all relevant information. The benefit recognized in our consolidated financial statements is the amount we expect to realize after examination by taxing authorities. If a tax position drops below the more-likely-than-not standard, the benefit can no longer be recognized. Assumptions, judgment, and the use of estimates are required in determining if the more-likely-than-not standard has been met when developing the provision for income taxes and in determining the expected benefit. A change in the assessment of the more-likely-than-not standard could materially impact our results of operations or financial position. Refer to Note K of the Notes to Consolidated Financial Statements contained in Item 8 of this Form 10-K for further discussion of our reserve for uncertain tax positions.
32
Item 7A. Quantitative and Qualitative Disclosures About Market Risk
Market Risk Factors
Changes in interest rates and interest rate risk: Funds held for clients are primarily comprised of short-term funds and AFS securities. Corporate investments are primarily comprised of AFS securities. As a result of our investing activities, we are exposed to changes in interest rates that may materially affect our results of operations and financial position. Changes in interest rates will impact the earnings potential of future investments and will cause fluctuations in the fair value of our longer-term AFS securities. We follow an investment strategy of protecting principal and optimizing liquidity. A substantial portion of our portfolios are invested in high credit quality securities with ratings of AA or higher, and A-1/P-1 ratings on short-term securities. We invest predominately in municipal bonds; corporate bonds; U.S. government agency securities; and VRDNs. We limit the amounts that can be invested in any single issuer and invest primarily in short- to intermediate-term instruments whose fair value is less sensitive to interest rate changes. We manage the AFS securities to a benchmark duration of two and one-half to three and three-quarters years.
During fiscal 2023, our primary short-term investment vehicles were bank demand deposit accounts, VRDNs and U.S. government agency discount notes. We have no exposure to high-risk or non-liquid investments. We have insignificant exposure to European investments. We have not and do not utilize derivative financial instruments to manage our interest rate risk.
During fiscal 2023, the average interest rate earned on our combined funds held for clients and corporate cash equivalents and investment portfolios was 2.7%, compared to 1.1% for fiscal 2022. When interest rates are rising, the full impact of higher interest rates will not immediately be reflected in net income due to the interaction of short- and long-term interest rate changes. During a rising interest rate environment, earnings will increase from our short-term investments, and over time, will increase from our longer-term AFS securities. Earnings from the AFS securities, which as of May 31, 2023 had an average duration of 3.3 years, would not reflect increases in interest rates until the investments are sold or mature and the proceeds are reinvested at higher rates.
The amortized cost and fair value of AFS securities that had stated maturities as of May 31, 2023 are shown below by expected maturity.
|
|
May 31, 2023 |
|
|||||||
|
|
Amortized |
|
|
Fair |
|
||||
In millions |
|
cost |
|
|
value |
|
||||
Maturity date: |
|
|
|
|
|
|
|
|
||
Due in one year or less |
|
$ |
|
186.4 |
|
|
$ |
|
184.1 |
|
Due after one year through three years |
|
|
|
829.4 |
|
|
|
|
789.6 |
|
Due after three years through five years |
|
|
|
1,953.7 |
|
|
|
|
1,843.5 |
|
Due after five years |
|
|
|
810.4 |
|
|
|
|
787.4 |
|
Total |
|
$ |
|
3,779.9 |
|
|
$ |
|
3,604.6 |
|
VRDNs are primarily categorized as due after five years in the table above as the contractual maturities on these securities are typically 20 to 30 years. Although these securities are issued as long-term securities, they are priced and traded as short-term instruments because of the liquidity provided through the tender feature.
As of May 31, 2023 and 2022, the Federal Funds rate was in the range of 5.00% to 5.25% and in the range of 0.75% to 1.00%, respectively. There continues to be uncertainty in the changing market and economic conditions, including the possibility of additional measures that could be taken by the Federal Reserve and other government agencies related to the concerns over inflation risk and the failure of financial institutions. We continue to monitor market conditions and take appropriate measures to manage our investment portfolios.
Calculating the future effects of changing interest rates involves many factors. These factors include, but are not limited to:
33
Subject to these factors and under normal financial market conditions, a 25-basis-point change in taxable interest rates generally affects our tax-exempt interest rates by approximately 17 basis points. Under normal financial market conditions, the impact to earnings from a 25-basis-point change in short-term interest rates would be approximately $4.0 million to $4.5 million, after taxes, for a twelve-month period. Such a basis point change may or may not be tied to changes in the Federal Funds rate.
Our total investment portfolio (funds held for clients and corporate cash equivalents and investments) averaged approximately $5.9 billion for fiscal 2023. Our anticipated allocation is approximately 40% invested in short-term securities and VRDNs with an average duration of less than 30 days, and 60% invested in available-for-sale securities with an average duration of two and one-half to three and three-quarters years.
The combined funds held for clients and corporate available-for-sale securities reflected net unrealized losses of $175.3 million and $136.3 million as of May 31, 2023 and 2022, respectively. Refer to Note G of the Notes to Consolidated Financial Statements contained in Item 8 of this Form 10-K for additional disclosures on fair value measurements.
During fiscal 2023, the net unrealized loss on our investment portfolios ranged from $126.5 million to $263.6 million. During fiscal 2022, the net unrealized loss or gain on our investment portfolios ranged from a $156.3 million net unrealized loss to a $89.2 million net unrealized gain. The net unrealized loss on our investment portfolios was approximately $198.8 million as of July 12, 2023.
As of May 31, 2023 and 2022, we had $3.6 billion and $4.0 billion, respectively, invested in AFS securities at fair value. The weighted-average yield-to-maturity was 2.9% and 1.9% as of May 31, 2023 and 2022, respectively. The weighted-average yield-to-maturity excludes AFS securities tied to short-term interest rates, such as VRDNs. Assuming a hypothetical increase in longer-term interest rates of 25 basis points, the resulting potential decrease in fair value for our portfolio of AFS securities as of May 31, 2023, would be approximately $25.0 million. Conversely, a corresponding decrease in interest rates would result in a comparable increase in fair value. This hypothetical increase or decrease in the fair value of the portfolio would be recorded as an adjustment to the portfolio’s recorded value, with an offsetting amount recorded in stockholders’ equity. These fluctuations in fair value would have no related or immediate impact on our results of operations unless any declines in fair value were considered to be other-than-temporary and an impairment loss recognized.
We are also exposed to interest rate risk through the use of our credit facilities as outlined in Liquidity and Capital Resources section of this Form 10-K. If interest rates were to increase, or we increase the frequency or amounts borrowed under these credit facilities, we could experience additional interest expense and a corresponding decrease in earnings.
Credit risk: We are exposed to credit risk in connection with these investments through the possible inability of the borrowers to meet the terms of their bonds. We regularly review our investment portfolios to determine if any investment is impaired due to increased credit risk or other valuation concerns and we believe that the investments we held as of May 31, 2023 were not impaired as a result of the previously discussed reasons. While $2.7 billion of our AFS securities had fair values that were below amortized cost, we believe that it is probable that the principal and interest will be collected in accordance with the contractual terms, and that the gross unrealized losses of $179.4 million were due to changes in interest rates and were not due to increased credit risk or other valuation concerns. Most of the AFS securities in an unrealized loss position as of May 31, 2023 and 2022 held an AA rating or better. We do not intend to sell these investments until the recovery of their amortized cost basis or maturity, and further believe that it is not more-likely-than-not that we will be required to sell these investments prior to that time. Our assessment that an investment is not impaired due to increased credit risk or other valuation concerns could change in the future due to new developments, including changes in our strategies or assumptions related to any particular investment.
We have some credit risk exposure relating to the purchase of accounts receivable as a means of providing payroll funding to clients in the temporary staffing industry. There is also credit risk exposure relating to the Company’s trade accounts receivable. These credit risk exposures are diversified among multiple client arrangements and all such arrangements are regularly reviewed for potential write-off. No single client is material in respect to total accounts receivable, service revenue, or results of operations.
Market risk: The U.S. banking market has recently experienced increased volatility as a result of several highly publicized distressed or closed banks, the most significant of these being Silicon Valley Bank. We have an ongoing monitoring
34
system for financial institutions we conduct business with and maintain cash balances at large well-capitalized (as defined by their regulators) financial institutions. We continue to closely monitor this situation and take appropriate measures, when necessary, to minimize potential risk exposure to our clients' and our cash and investment balances. We have not realized any losses as a result of this increased market volatility.
35
Item 8. Financial Statements and Supplementary Data
TABLE OF CONTENTS
36
REPORT ON MANAGEMENT’S ASSESSMENT OF
INTERNAL CONTROL OVER FINANCIAL REPORTING
Management of Paychex, Inc. (the “Company”) is responsible for establishing and maintaining adequate internal control over financial reporting as such term is defined in Rules 13a-15(f) and 15d-15(f) under the Securities Exchange Act of 1934, as amended. The Company’s internal control over financial reporting is designed to provide reasonable assurance regarding the reliability of financial reporting and the preparation of the financial statements for external purposes in accordance with generally accepted accounting principles.
Because of its inherent limitations, internal control over financial reporting may not prevent or detect misstatements. Also, projections of any evaluation of effectiveness to future periods are subject to the risk that controls may become inadequate because of changes in conditions, or that the degree of compliance with the policies or procedures may deteriorate.
Management assessed the effectiveness of the Company’s internal control over financial reporting as of May 31, 2023. In making this assessment, management used the criteria set forth by the Committee of Sponsoring Organizations of the Treadway Commission in “Internal Control — Integrated Framework” (2013). Based on our assessment, management determined that the Company maintained effective internal control over financial reporting as of May 31, 2023.
The Company’s independent registered public accounting firm, PricewaterhouseCoopers LLP, is appointed by the Company’s Audit Committee. PricewaterhouseCoopers LLP has audited the Consolidated Financial Statements included in this Annual Report on Form 10-K and the effectiveness of the Company’s internal control over financial reporting as of May 31, 2023, and as a part of their integrated audit, has issued their report, included herein, on the effectiveness of the Company’s internal control over financial reporting.
/s/ John B. Gibson John B. Gibson President and Chief Executive Officer |
|
/s/ Efrain Rivera Efrain Rivera Senior Vice President and Chief Financial Officer |
37
REPORT OF INDEPENDENT REGISTERED PUBLIC ACCOUNTING FIRM
To the Board of Directors and Stockholders of Paychex, Inc.
Opinions on the Financial Statements and Internal Control over Financial Reporting
We have audited the accompanying consolidated balance sheets of Paychex, Inc. and its subsidiaries (the “Company”) as of May 31, 2023 and 2022, and the related consolidated statements of income and comprehensive income, of stockholders’ equity and of cash flows for each of the three years in the period ended May 31, 2023, including the related notes and financial statement schedule listed in the accompanying index (collectively referred to as the “consolidated financial statements”). We also have audited the Company's internal control over financial reporting as of May 31, 2023, based on criteria established in Internal Control - Integrated Framework (2013) issued by the Committee of Sponsoring Organizations of the Treadway Commission (COSO).
In our opinion, the consolidated financial statements referred to above present fairly, in all material respects, the financial position of the Company as of May 31, 2023 and 2022, and the results of its operations and its cash flows for each of the three years in the period ended May 31, 2023 in conformity with accounting principles generally accepted in the United States of America. Also in our opinion, the Company maintained, in all material respects, effective internal control over financial reporting as of May 31, 2023, based on criteria established in Internal Control - Integrated Framework (2013) issued by the COSO.
Basis for Opinions
The Company's management is responsible for these consolidated financial statements, for maintaining effective internal control over financial reporting, and for its assessment of the effectiveness of internal control over financial reporting, included in the accompanying Report on Management's Assessment of Internal Control Over Financial Reporting. Our responsibility is to express opinions on the Company’s consolidated financial statements and on the Company's internal control over financial reporting based on our audits. We are a public accounting firm registered with the Public Company Accounting Oversight Board (United States) (PCAOB) and are required to be independent with respect to the Company in accordance with the U.S. federal securities laws and the applicable rules and regulations of the Securities and Exchange Commission and the PCAOB.
We conducted our audits in accordance with the standards of the PCAOB. Those standards require that we plan and perform the audits to obtain reasonable assurance about whether the consolidated financial statements are free of material misstatement, whether due to error or fraud, and whether effective internal control over financial reporting was maintained in all material respects.
Our audits of the consolidated financial statements included performing procedures to assess the risks of material misstatement of the consolidated financial statements, whether due to error or fraud, and performing procedures that respond to those risks. Such procedures included examining, on a test basis, evidence regarding the amounts and disclosures in the consolidated financial statements. Our audits also included evaluating the accounting principles used and significant estimates made by management, as well as evaluating the overall presentation of the consolidated financial statements. Our audit of internal control over financial reporting included obtaining an understanding of internal control over financial reporting, assessing the risk that a material weakness exists, and testing and evaluating the design and operating effectiveness of internal control based on the assessed risk. Our audits also included performing such other procedures as we considered necessary in the circumstances. We believe that our audits provide a reasonable basis for our opinions.
Definition and Limitations of Internal Control over Financial Reporting
A company’s internal control over financial reporting is a process designed to provide reasonable assurance regarding the reliability of financial reporting and the preparation of financial statements for external purposes in accordance with generally accepted accounting principles. A company’s internal control over financial reporting includes those policies and procedures that (i) pertain to the maintenance of records that, in reasonable detail, accurately and fairly reflect the transactions and dispositions of the assets of the company; (ii) provide reasonable assurance that transactions are recorded as necessary to permit preparation of financial statements in accordance with generally accepted accounting principles, and that receipts and expenditures of the company are being made only in accordance with authorizations of management and directors of the company; and (iii) provide reasonable assurance regarding prevention or timely detection of unauthorized acquisition, use, or disposition of the company’s assets that could have a material effect on the financial statements.
38
Because of its inherent limitations, internal control over financial reporting may not prevent or detect misstatements. Also, projections of any evaluation of effectiveness to future periods are subject to the risk that controls may become inadequate because of changes in conditions, or that the degree of compliance with the policies or procedures may deteriorate.
Critical Audit Matters
The critical audit matter communicated below is a matter arising from the current period audit of the consolidated financial statements that was communicated or required to be communicated to the audit committee and that (i) relates to accounts or disclosures that are material to the consolidated financial statements and (ii) involved our especially challenging, subjective, or complex judgments. The communication of critical audit matters does not alter in any way our opinion on the consolidated financial statements, taken as a whole, and we are not, by communicating the critical audit matter below, providing a separate opinion on the critical audit matter or on the accounts or disclosures to which it relates.
Professional Employer Organization (PEO) Insurance Reserves - Workers’ Compensation Insurance Reserves
As described in Note A to the consolidated financial statements, the Company offers workers’ compensation insurance to clients for the benefit of client employees. Workers’ compensation insurance is primarily provided under fully insured high deductible workers’ compensation insurance policies. Workers’ compensation insurance reserves are established to provide for the estimated costs of paying claims up to per occurrence liability limits. As of May 31, 2023, the total liability for workers’ compensation insurance reserves is $195.8 million. In establishing the workers' compensation insurance reserves, management uses an independent actuarial estimate of undiscounted future cash payments that would be made to settle the claims. The determination of estimated ultimate losses by the Company’s actuary are based on accepted actuarial methods and assumptions. The estimated ultimate losses are primarily based upon loss development factors, and other factors such as the nature of employees’ job responsibilities, the historical frequency and severity of workers’ compensation claims, and an estimate of future cost trends. The principal considerations for our determination that performing procedures relating to PEO insurance reserves - workers’ compensation insurance reserves is a critical audit matter are (i) there was significant judgment used by management in determining the workers’ compensation insurance reserves, which in turn led to a high degree of auditor judgment, subjectivity and effort in performing our procedures and evaluating management’s assumptions and actuarial estimates related to the loss development factors and other factors such as the historical frequency and severity of workers’ compensation claims and an estimate of future cost trends, and (ii) the audit effort included the involvement of professionals with specialized skill and knowledges.
Addressing the matter involved performing procedures and evaluating audit evidence in connection with forming our overall opinion on the consolidated financial statements. These procedures included testing the effectiveness of controls relating to the Company’s workers’ compensation insurance reserves, including controls over the development of management’s assumptions and actuarial estimates related to the loss development factors. These procedures also included, among others (i) the involvement of professionals with specialized skill and knowledge to assist in developing an independent estimate of the workers’ compensation insurance reserves and (ii) comparison of this independent estimate to management’s estimate to evaluate the reasonableness of management’s estimate. Developing an independent estimate involved (i) testing the completeness and accuracy of data provided by management and (ii) evaluating management’s model, assumptions and actuarial estimates related to the loss development factors and other factors such as the historical frequency and severity of workers’ compensation claims and an estimate of future cost trends.
/s/
July 14, 2023
We have served as the Company’s auditor since 2013.
39
PAYCHEX, INC.
CONSOLIDATED STATEMENTS OF INCOME AND COMPREHENSIVE INCOME
In millions, except per share amounts
Year ended May 31, |
|
|
2023 |
|
|
|
2022 |
|
|
|
2021 |
|
|||
Revenue: |
|
|
|
|
|
|
|
|
|
|
|
|
|||
Management Solutions |
|
$ |
|
|
|
$ |
|
|
|
$ |
|
|
|||
PEO and Insurance Solutions |
|
|
|
|
|
|
|
|
|
|
|
|
|||
Total service revenue |
|
|
|
|
|
|
|
|
|
|
|
|
|||
Interest on funds held for clients |
|
|
|
|
|
|
|
|
|
|
|
|
|||
Total revenue |
|
|
|
|
|
|
|
|
|
|
|
|
|||
Expenses: |
|
|
|
|
|
|
|
|
|
|
|
|
|||
Cost of service revenue |
|
|
|
|
|
|
|
|
|
|
|
|
|||
Selling, general and administrative expenses |
|
|
|
|
|
|
|
|
|
|
|
|
|||
Total expenses |
|
|
|
|
|
|
|
|
|
|
|
|
|||
Operating income |
|
|
|
|
|
|
|
|
|
|
|
|
|||
Other income/(expense), net |
|
|
|
|
|
|
|
( |
) |
|
|
|
( |
) |
|
Income before income taxes |
|
|
|
|
|
|
|
|
|
|
|
|
|||
Income taxes |
|
|
|
|
|
|
|
|
|
|
|
|
|||
Net income |
|
$ |
|
|
|
$ |
|
|
|
$ |
|
|
|||
|
|
|
|
|
|
|
|
|
|
|
|
|
|||
Other comprehensive loss, net of tax |
|
|
|
( |
) |
|
|
|
( |
) |
|
|
|
( | ) |
Comprehensive income |
|
$ |
|
|
|
$ |
|
|
|
$ |
|
|
|||
|
|
|
|
|
|
|
|
|
|
|
|
|
|||
Basic earnings per share |
|
$ |
|
|
|
$ |
|
|
|
$ |
|
|
|||
Diluted earnings per share |
|
$ |
|
|
|
$ |
|
|
|
$ |
|
|
|||
Weighted-average common shares outstanding |
|
|
|
|
|
|
|
|
|
|
|
|
|||
Weighted-average common shares outstanding, assuming |
|
|
|
|
|
|
|
|
|
|
|
|
|||
See Notes to Consolidated Financial Statements.
40
PAYCHEX, INC.
CONSOLIDATED BALANCE SHEETS
In millions, except per share amounts
As of May 31, |
|
2023 |
|
|
2022 |
|
||||
Assets |
|
|
|
|
|
|
|
|
||
Cash and cash equivalents |
|
$ |
|
|
|
$ |
|
|
||
Restricted cash |
|
|
|
|
|
|
|
|
||
Corporate investments |
|
|
|
|
|
|
|
|
||
Interest receivable |
|
|
|
|
|
|
|
|
||
Accounts receivable, net of allowance for credit losses |
|
|
|
|
|
|
|
|
||
PEO unbilled receivables, net of advance collections |
|
|
|
|
|
|
|
|
||
Prepaid income taxes |
|
|
|
|
|
|
|
|
||
Prepaid expenses and other current assets |
|
|
|
|
|
|
|
|
||
Current assets before funds held for clients |
|
|
|
|
|
|
|
|
||
Funds held for clients |
|
|
|
|
|
|
|
|
||
Total current assets |
|
|
|
|
|
|
|
|
||
Long-term restricted cash |
|
|
|
— |
|
|
|
|
|
|
Long-term corporate investments |
|
|
|
|
|
|
|
|
||
Property and equipment, net of accumulated depreciation |
|
|
|
|
|
|
|
|
||
Operating lease right-of-use assets, net of accumulated amortization |
|
|
|
|
|
|
|
|
||
Intangible assets, net of accumulated amortization |
|
|
|
|
|
|
|
|
||
Goodwill |
|
|
|
|
|
|
|
|
||
Long-term deferred costs |
|
|
|
|
|
|
|
|
||
Other long-term assets |
|
|
|
|
|
|
|
|
||
Total assets |
|
$ |
|
|
|
$ |
|
|
||
Liabilities |
|
|
|
|
|
|
|
|
||
Accounts payable |
|
$ |
|
|
|
$ |
|
|
||
Accrued corporate compensation and related items |
|
|
|
|
|
|
|
|
||
Accrued worksite employee compensation and related items |
|
|
|
|
|
|
|
|
||
Short-term borrowings |
|
|
|
|
|
|
|
|
||
Deferred revenue |
|
|
|
|
|
|
|
|
||
Other current liabilities |
|
|
|
|
|
|
|
|
||
Current liabilities before client fund obligations |
|
|
|
|
|
|
|
|
||
Client fund obligations |
|
|
|
|
|
|
|
|
||
Total current liabilities |
|
|
|
|
|
|
|
|
||
Accrued income taxes |
|
|
|
|
|
|
|
|
||
Deferred income taxes |
|
|
|
|
|
|
|
|
||
Long-term borrowings, net of debt issuance costs |
|
|
|
|
|
|
|
|
||
Operating lease liabilities |
|
|
|
|
|
|
|
|
||
Other long-term liabilities |
|
|
|
|
|
|
|
|
||
Total liabilities |
|
|
|
|
|
|
|
|
||
— Note P |
|
|
|
|
|
|
|
|
||
Stockholders’ equity |
|
|
|
|
|
|
|
|
||
Common stock, $ |
|
|
|
|
|
|
|
|
||
Additional paid-in capital |
|
|
|
|
|
|
|
|
||
Retained earnings |
|
|
|
|
|
|
|
|
||
Accumulated other comprehensive loss |
|
|
|
( |
) |
|
|
|
( |
) |
Total stockholders’ equity |
|
|
|
|
|
|
|
|
||
Total liabilities and stockholders’ equity |
|
$ |
|
|
|
$ |
|
|
||
See Notes to Consolidated Financial Statements.
41
PAYCHEX, INC.
CONSOLIDATED STATEMENTS OF STOCKHOLDERS’ EQUITY
In millions, except per share amounts
|
|
|
|
|
|
|
|
|
|
|
|
|
|
|
|
|
|
|
|
|
|
|
|
||||||
|
|
|
|
|
|
|
|
|
|
|
|
|
|
|
|
|
Accumulated |
|
|
|
|
|
|||||||
|
|
|
|
|
|
|
|
|
Additional |
|
|
|
|
|
|
other |
|
|
|
|
|
||||||||
|
|
Common stock |
|
|
paid-in |
|
|
Retained |
|
|
comprehensive |
|
|
|
|
|
|||||||||||||
|
|
Shares |
|
|
Amount |
|
|
capital |
|
|
earnings |
|
|
income/(loss) |
|
|
Total |
|
|||||||||||
Balance as of May 31, 2020 |
|
|
|
|
$ |
|
|
|
$ |
|
|
|
$ |
|
|
|
$ |
|
|
|
$ |
|
|
||||||
Net income |
|
|
— |
|
|
|
|
— |
|
|
|
|
— |
|
|
|
|
|
|
|
|
— |
|
|
|
|
|
||
Unrealized losses on securities, net of $ |
|
|
— |
|
|
|
|
— |
|
|
|
|
— |
|
|
|
|
— |
|
|
|
|
( |
) |
|
|
|
( |
) |
Reclassification adjustment for realized gains on securities, net of $ |
|
|
— |
|
|
|
|
— |
|
|
|
|
— |
|
|
|
|
— |
|
|
|
|
( |
) |
|
|
|
( |
) |
Dividends declared ($ |
|
|
— |
|
|
|
|
— |
|
|
|
|
— |
|
|
|
|
( |
) |
|
|
|
— |
|
|
|
|
( |
) |
Repurchases of common shares (2) |
|
|
( |
) |
|
|
|
— |
|
|
|
|
( |
) |
|
|
|
( |
) |
|
|
|
— |
|
|
|
|
( |
) |
Stock-based compensation |
|
|
— |
|
|
|
|
— |
|
|
|
|
|
|
|
|
— |
|
|
|
|
— |
|
|
|
|
|
||
Foreign currency translation adjustment |
|
|
— |
|
|
|
|
— |
|
|
|
|
— |
|
|
|
|
— |
|
|
|
|
|
|
|
|
|
||
Activity related to equity-based plans |
|
|
|
|
|
|
— |
|
|
|
|
|
|
|
|
( |
) |
|
|
|
— |
|
|
|
|
|
|||
Balance as of May 31, 2021 |
|
|
|
|
|
|
|
|
|
|
|
|
|
|
|
|
|
|
|
|
|
|
|
||||||
Net income |
|
|
— |
|
|
|
|
— |
|
|
|
|
— |
|
|
|
|
|
|
|
|
— |
|
|
|
|
|
||
Unrealized losses on securities, net of $ |
|
|
— |
|
|
|
|
— |
|
|
|
|
— |
|
|
|
|
— |
|
|
|
|
( |
) |
|
|
|
( |
) |
Reclassification adjustment for realized gains on securities, net of $ |
|
|
— |
|
|
|
|
— |
|
|
|
|
— |
|
|
|
|
— |
|
|
|
|
( |
) |
|
|
|
( |
) |
Dividends declared ($ |
|
|
— |
|
|
|
|
— |
|
|
|
|
— |
|
|
|
|
( |
) |
|
|
|
— |
|
|
|
|
( |
) |
Repurchases of common shares (2) |
|
|
( |
) |
|
|
|
— |
|
|
|
|
( |
) |
|
|
|
( |
) |
|
|
|
— |
|
|
|
|
( |
) |
Stock-based compensation |
|
|
— |
|
|
|
|
— |
|
|
|
|
|
|
|
|
— |
|
|
|
|
— |
|
|
|
|
|
||
Foreign currency translation adjustment |
|
|
— |
|
|
|
|
— |
|
|
|
|
— |
|
|
|
|
— |
|
|
|
|
( |
) |
|
|
|
( |
) |
Activity related to equity-based plans |
|
|
|
|
|
|
— |
|
|
|
|
|
|
|
|
( |
) |
|
|
|
— |
|
|
|
|
|
|||
Balance as of May 31, 2022 |
|
|
|
|
|
|
|
|
|
|
|
|
|
|
|
|
|
|
( |
) |
|
|
|
|
|||||
Net income |
|
|
— |
|
|
|
|
— |
|
|
|
|
— |
|
|
|
|
|
|
|
|
— |
|
|
|
|
|
||
Unrealized losses on securities, net of $ |
|
|
— |
|
|
|
|
— |
|
|
|
|
— |
|
|
|
|
— |
|
|
|
|
( |
) |
|
|
|
( |
) |
Reclassification adjustment for realized losses on securities, net of |
|
|
— |
|
|
|
|
— |
|
|
|
|
— |
|
|
|
|
— |
|
|
|
|
|
|
|
|
|
||
Dividends declared ($ |
|
|
— |
|
|
|
|
— |
|
|
|
|
— |
|
|
|
|
( |
) |
|
|
|
— |
|
|
|
|
( |
) |
Repurchases of common shares (2) |
|
|
— |
|
|
|
|
— |
|
|
|
|
— |
|
|
|
|
— |
|
|
|
|
— |
|
|
|
|
— |
|
Stock-based compensation |
|
|
— |
|
|
|
|
— |
|
|
|
|
|
|
|
|
— |
|
|
|
|
— |
|
|
|
|
|
||
Foreign currency translation adjustment |
|
|
— |
|
|
|
|
— |
|
|
|
|
— |
|
|
|
|
— |
|
|
|
|
|
|
|
|
|
||
Activity related to equity-based plans |
|
|
|
|
|
|
|
|
|
|
|
|
|
|
( |
) |
|
|
|
— |
|
|
|
|
( |
) |
|||
Balance as of May 31, 2023 |
|
|
|
|
$ |
|
|
|
$ |
|
|
|
$ |
|
|
|
$ |
|
( |
) |
|
$ |
|
|
|||||
See Notes to Consolidated Financial Statements.
42
PAYCHEX, INC.
CONSOLIDATED STATEMENTS OF CASH FLOWS
In millions
Year ended May 31, |
|
2023 |
|
|
2022 |
|
|
2021 |
|
||||||
Operating activities |
|
|
|
|
|
|
|
|
|
|
|
|
|||
Net income |
|
$ |
|
|
|
$ |
|
|
|
$ |
|
|
|||
Adjustments to reconcile net income to net cash provided by operating |
|
|
|
|
|
|
|
|
|
|
|
|
|||
Depreciation and amortization |
|
|
|
|
|
|
|
|
|
|
|
|
|||
Amortization of premiums and discounts on AFS securities, net |
|
|
|
|
|
|
|
|
|
|
|
|
|||
Amortization of deferred contract costs |
|
|
|
|
|
|
|
|
|
|
|
|
|||
Stock-based compensation costs |
|
|
|
|
|
|
|
|
|
|
|
|
|||
(Benefit from)/provision for deferred income taxes |
|
|
|
( |
) |
|
|
|
|
|
|
|
( |
) |
|
Provision for credit losses |
|
|
|
|
|
|
|
|
|
|
|
|
|||
Net realized losses/(gains) on sales of AFS securities |
|
|
|
|
|
|
|
( |
) |
|
|
|
( |
) |
|
Changes in operating assets and liabilities: |
|
|
|
|
|
|
|
|
|
|
|
|
|||
Interest receivable |
|
|
|
( |
) |
|
|
|
|
|
|
|
|
||
Accounts receivable and PEO unbilled receivables, net |
|
|
|
( |
) |
|
|
|
( |
) |
|
|
|
( |
) |
Prepaid expenses and other current assets |
|
|
|
( |
) |
|
|
|
( |
) |
|
|
|
( |
) |
Accounts payable and other current liabilities |
|
|
|
|
|
|
|
|
|
|
|
|
|||
Deferred costs |
|
|
|
( |
) |
|
|
|
( |
) |
|
|
|
( |
) |
Net change in other long-term assets and liabilities |
|
|
|
|
|
|
|
|
|
|
|
|
|||
Net change in operating lease right-of-use assets and liabilities |
|
|
|
( |
) |
|
|
|
( |
) |
|
|
|
( |
) |
Net cash provided by operating activities |
|
|
|
|
|
|
|
|
|
|
|
|
|||
Investing activities |
|
|
|
|
|
|
|
|
|
|
|
|
|||
Purchases of AFS securities |
|
|
|
( |
) |
|
|
|
( |
) |
|
|
|
( |
) |
Proceeds from sales and maturities of AFS securities |
|
|
|
|
|
|
|
|
|
|
|
|
|||
Purchases of property and equipment |
|
|
|
( |
) |
|
|
|
( |
) |
|
|
|
( |
) |
Proceeds from sale of property and equipment |
|
|
|
|
|
|
|
|
|
|
|
|
|||
Acquisition of businesses, net of cash acquired |
|
|
|
( |
) |
|
|
|
( |
) |
|
|
|
( |
) |
Purchases of other assets |
|
|
|
( |
) |
|
|
|
( |
) |
|
|
|
( |
) |
Net cash provided by/(used in) investing activities |
|
|
|
|
|
|
|
( |
) |
|
|
|
( |
) |
|
Financing activities |
|
|
|
|
|
|
|
|
|
|
|
|
|||
Net change in client fund obligations |
|
|
|
|
|
|
|
|
|
|
|
|
|||
Net proceeds from short-term borrowings |
|
|
|
|
|
|
|
|
|
|
|
|
|||
Dividends paid |
|
|
|
( |
) |
|
|
|
( |
) |
|
|
|
( |
) |
Repurchases of common shares |
|
|
|
— |
|
|
|
|
( |
) |
|
|
|
( |
) |
Contingent consideration paid for acquisitions |
|
|
|
( |
) |
|
|
|
( |
) |
|
|
|
— |
|
Activity related to equity-based plans |
|
|
|
( |
) |
|
|
|
|
|
|
|
|
||
Net cash used in financing activities |
|
|
|
( |
) |
|
|
|
( |
) |
|
|
|
( |
) |
Net change in cash, restricted cash, and equivalents |
|
|
|
|
|
|
|
( |
) |
|
|
|
|
||
Cash, restricted cash, and equivalents, beginning of fiscal year |
|
|
|
|
|
|
|
|
|
|
|
|
|||
Cash, restricted cash, and equivalents, end of fiscal year |
|
$ |
|
|
|
$ |
|
|
|
$ |
|
|
|||
|
|
|
|
|
|
|
|
|
|
|
|
|
|||
Reconciliation of cash, restricted cash, and equivalents |
|
|
|
|
|
|
|
|
|
|
|
|
|||
Cash and cash equivalents |
|
$ |
|
|
|
$ |
|
|
|
$ |
|
|
|||
Restricted cash |
|
|
|
|
|
|
|
|
|
|
|
|
|||
Restricted cash and restricted cash equivalents included in funds held for clients |
|
|
|
|
|
|
|
|
|
|
|
|
|||
Total cash, restricted cash, and equivalents |
|
$ |
|
|
|
$ |
|
|
|
$ |
|
|
|||
See Notes to Consolidated Financial Statements.
43
PAYCHEX, INC.
NOTES TO CONSOLIDATED FINANCIAL STATEMENTS
Note A — Description of Business, Basis of Presentation, and Significant Accounting Policies
Description of business: Paychex, Inc. and its wholly owned subsidiaries (collectively, the “Company” or “Paychex”) is a leading provider of integrated human capital management (“HCM”) solutions for human resources (“HR”), payroll, benefits, and insurance for small- to medium-sized businesses in the United States (“U.S.”) and parts of Europe. The Company also has operations in India.
Paychex, a Delaware corporation formed in 1979, reports as
Within Paychex’s HCM solutions, the Company offers a comprehensive portfolio of HCM technology and HR advisory solutions that help our clients address the evolving challenges of HR. Clients may choose to have our support teams handle everything for them, or select services on an á la carte basis or as part of various solution bundles. Paychex’s offerings often leverage the information gathered in its base payroll processing service, allowing the Company to provide comprehensive outsourcing services covering the HCM spectrum.
Paychex supports its small business clients utilizing its proprietary, robust, software as a service (“SaaS”) Paychex Flex® platform and the Company’s SurePayroll® SaaS-based solutions. Both solutions allow users to process payroll when they want, how they want, and on any type of device (desktop, tablet, and mobile phone). Paychex’s medium-sized clients generally have more complex payroll and employee benefit needs and can opt for an integrated suite of HCM solutions, which allows them to choose the services and software that will meet the needs of their businesses.
Total revenue is comprised of service revenue and interest on funds held for clients. Service revenue is comprised primarily of the fees earned on the portfolio of HCM services, which include payroll processing, complementary HR management and administration services, professional employer organization (“PEO”) solutions, and insurance agency commissions. Refer to Note B of this Item 8 for further discussion of the Company’s service revenue.
Basis of presentation: The consolidated financial statements include the accounts of the Company and its wholly owned subsidiaries. All intercompany accounts and transactions have been eliminated in consolidation. Certain disclosures are reported as zero balances due to rounding.
Reclassifications: Certain prior year amounts have been reclassified to conform to the current period presentation. These reclassifications had no effect on reported consolidated earnings.
Cash and cash equivalents: Cash and cash equivalents consist of available cash, money market securities, and other investments with a maturity of 90 days or less at acquisition. Cash and cash equivalents include funds collected from the Company’s PEO clients for the payment of worksite employee payrolls and associated payroll taxes. $
Restricted cash and restricted cash equivalents: Restricted cash and restricted cash equivalents are recorded at fair value, and consist of cash and cash equivalents, primarily money market securities, included in funds held for clients and cash that is restricted in use to secure commitments for certain workers’ compensation insurance policies.
Accounts receivable, net of allowance for credit losses: Accounts receivable balances are shown on the Consolidated Balance Sheets net of the allowance for credit losses of $
44
The Company is exposed to credit losses through the sale of its solutions and support, payment of client obligations, and collection of purchased receivables. To mitigate this credit risk, the Company has multiple programs in place to assess and continuously monitor each client’s ability to pay for these solutions and support. Credit monitoring programs include, but are not limited to, new client credit reviews, establishing appropriate credit limits, monitoring of credit distressed clients, and early electronic wire and collection procedures. The Company also considers contract terms and conditions, client business type or strategy and may require collateralized asset support or prepayment to mitigate credit risk.
Accounts receivable are written off and charged against the allowance for credit losses when the Company has exhausted all collection efforts without success. The Company estimates its allowance for credit losses based on historical loss activity adjusted for current economic conditions and reasonable and supportable forecast factors, when applicable. The provision for the allowance for credit losses and accounts written off were
PEO unbilled receivables, net of advance collections: The Company recognizes a liability for worksite employee gross wages and related payroll tax liabilities at the end of the period in which the worksite employee performs work, and where it assumes, under applicable federal and state regulations, the obligation for the payment of payroll and payroll tax liabilities. The estimated payroll and payroll tax liabilities are recorded in accrued worksite employee compensation and related items on the Company’s Consolidated Balance Sheets. The associated unbilled receivables, including estimated revenues, offset by advance collections from clients, are recorded as PEO unbilled receivables, net of advance collections on the Company’s Consolidated Balance Sheets. As of May 31, 2023 and 2022, advance collections were $
Funds held for clients and corporate investments: Marketable securities included in funds held for clients and corporate investments consist primarily of securities classified as AFS and are recorded at fair value obtained from an independent pricing service. The funds held for clients portfolio also includes cash and cash equivalents such as money market securities. Unrealized gains and losses, net of applicable income taxes, are reported as other comprehensive income or loss in the Consolidated Statements of Income and Comprehensive Income. Realized gains and losses on the sale of AFS securities are determined by specific identification of the cost basis of each security. On the Consolidated Statements of Income and Comprehensive Income, realized gains and losses from the funds held for clients portfolio and corporate investments portfolio are included in interest on funds held for clients and other income/(expense), net, respectively.
Concentrations: Substantially all the Company’s deposited cash is maintained at large well-capitalized (as defined by their regulators) financial institutions. These deposits may exceed the amount of any insurance provided. All the Company’s deliverable securities, primarily municipal bond securities, are held in custody with certain of the aforementioned financial institutions, for which that institution bears the risk of custodial loss. Non-deliverable securities are primarily time deposits and money market funds.
Property and equipment, net of accumulated depreciation: Property and equipment is stated at cost, less accumulated depreciation. Depreciation is based on the estimated useful lives of property and equipment using the straight-line method.
Category |
|
Depreciable life |
Buildings and improvements |
|
|
Data processing equipment |
|
|
Furniture, fixtures, and equipment |
|
|
Leasehold improvements |
|
|
Software |
|
|
Normal and recurring repairs and maintenance costs are charged to expense as incurred. The Company reviews the carrying value of property and equipment for impairment when events or changes in circumstances indicate that the carrying value of such assets may not be recoverable.
45
Software development and enhancements: Expenditures for software purchases and software developed for internal use are capitalized and depreciated on a straight-line basis over the estimated useful lives, which are generally
Goodwill and other intangible assets, net of accumulated amortization: Goodwill is not amortized, but instead is tested for impairment on an annual basis and between annual tests if an event occurs or circumstances change in a way to indicate that there has been a potential decline in the fair value of a reporting unit. The Company performs its annual impairment testing in its fiscal fourth quarter. During fiscal 2023 and fiscal 2021, a qualitative analysis was performed on all reporting units to determine if it is more-likely-than-not that the fair value of the reporting units had declined below their carrying value. During fiscal 2022, a qualitative assessment was performed for our Paychex, Inc., excluding Purchased Receivables, reporting unit, and a quantitative assessment was performed on the Purchased Receivable reporting unit. The qualitative assessment considered various financial, macroeconomic, industry, and reporting unit specific qualitative factors. Based on the results of the Company’s testing,
Intangible assets are comprised primarily of client list acquisitions and are reported net of accumulated amortization on the Consolidated Balance Sheets. Intangible assets are amortized over periods generally ranging from
Impairment of Long-Lived Assets: Long-lived assets, including intangible assets with finite lives and operating lease right-of-use (“ROU”) assets, are reviewed for impairment when events or changes in circumstances indicate that the carrying amount of an asset may not be recoverable. The recoverability of assets to be held and used is measured by a comparison of the carrying amount of an asset to estimated undiscounted future cash flows expected to be generated by the asset. If the carrying amount of an asset exceeds its estimated future cash flows, an impairment charge is recognized for the amount by which the carrying amount of the asset exceeds the estimated fair value of the asset. The Company has determined that there was
Foreign Currency: The financial statements of the Company’s foreign subsidiaries have been translated into U.S. dollars. Assets and liabilities are translated into U.S. dollars at period-end exchange rates. Income and expenses are translated at the average exchange rate for the reporting period. The resulting non-cash foreign currency translation adjustments, representing unrealized gains or losses, are included in Consolidated Statements of Stockholders’ Equity as a component of accumulated other comprehensive income/(loss), net of tax. The Company did
Revenue recognition: Revenues are primarily attributable to fees for providing services as well as investment income earned on funds held for clients. Fees associated with services are recognized when control of the contracted services is transferred to the Company's clients, in an amount that reflects the consideration it expects to receive in exchange for such services. The Company’s service revenue is largely attributable to processing services where the fee is based on a fixed amount per processing period or a fixed amount per processing period plus a fee per employee or transaction processed. Insurance Solutions revenues are recognized when commissions are earned on premiums billed and collected. Fees earned for funding payrolls of clients in the temporary staffing agency via the purchase of accounts receivable are based on a percentage of funding amounts as specified in the client contract. These fees are then recognized over the average collection period of
46
The Company receives advance payments for set-up fees from its clients. Advance payments received for certain service offerings for set-up fees are considered a material right. Therefore, the Company defers the revenue associated with these advance payments, recognizing the revenue and related expenses over the expected period to which the material right exists.
PEO Solutions revenue is included in service revenue and is reported net of certain pass-through costs billed and incurred, which include payroll wages, payroll taxes, including federal and state unemployment insurance, and certain health insurance benefit premiums, primarily costs related to the Company’s guaranteed cost benefit plans. Direct costs related to workers’ compensation and certain benefit plans where the Company retains risk are recognized as cost of service revenue rather than as a reduction in service revenue. Refer to Note B of this Item 8 for further discussion of the PEO pass-through costs.
Interest on funds held for clients is earned primarily on funds that are collected from clients before due dates for payroll tax administration services and for employee payment services and invested until remittance to the applicable tax or regulatory agencies or client employees. The interest earned on these funds is included in total revenue on the Consolidated Statements of Income and Comprehensive Income because the collecting, holding, and remitting of these funds are components of providing these services.
Assets Recognized from the Costs to Obtain and Fulfill Contracts: The Company recognizes an asset for the incremental costs of obtaining a contract with a client if it is expected that the economic benefit and amortization period will be longer than one year. Incremental costs of obtaining a contract include only those costs that are directly related to the acquisition of new contracts and that would not have been incurred if the contract had not been obtained. The Company does not incur incremental costs to obtain a contract renewal. The Company determined that certain sales commissions and bonuses, including related fringe benefits, meet the capitalization criteria under Accounting Standards Codification (“ASC”) Subtopic 340-40, “Other Assets and Deferred Costs: Contracts with Customers” (“ASC 340-40”). The Company also recognizes an asset for the costs to fulfill a contract with a client if the costs are specifically identifiable, generate or enhance resources used to satisfy future performance obligations, and are expected to be recovered. The Company has determined that substantially all costs related to implementation activities are administrative in nature and meet the capitalization criteria under ASC 340-40. These capitalized costs to fulfill a contract principally relate to upfront direct costs that are expected to be recovered and enhance the Company’s ability to satisfy future performance obligations.
The assets related to both costs to obtain and costs to fulfill contracts with clients are capitalized and amortized using an accelerated method over an eight-year life to closely align with the pattern of client attrition over the estimated life of the client relationship. The Company regularly reviews its deferred costs for potential impairment and did
Cost of service revenue: The Company’s costs and expenses applicable to total service revenue represent direct costs associated with providing HR, payroll, benefits, and insurance services. This includes labor-related costs, direct costs related to certain PEO solutions, postage and delivery costs, facility costs, professional services, and depreciation and amortization of property and equipment, including internally developed software.
Selling, general and administrative expenses: The Company’s selling, general and administrative expenses represent labor-related costs, including amortization of deferred sales commissions and bonuses, corporate asset depreciation and amortization, marketing, and other general and administrative expenses incurred by the Company.
PEO insurance reserves: As part of its PEO solution, the Company offers workers’ compensation insurance and health insurance to clients for the benefit of client employees. Workers’ compensation insurance is primarily provided under fully insured high deductible workers’ compensation insurance policies. Workers’ compensation insurance reserves are established to provide for the estimated costs of paying claims up to per occurrence liability limits. These reserves include estimates of certain expenses associated with processing and settling these claims. In establishing the PEO workers’ compensation insurance reserves, the Company uses an independent actuarial estimate of undiscounted future cash payments that would be made to settle claims. The determination of estimated ultimate losses by the Company’s independent actuary are based on accepted actuarial methods and assumptions. The estimated ultimate losses are primarily based upon loss development factors, and other factors such as the nature of employees’ job responsibilities, the historical frequency and severity of workers’ compensation claims, and an estimate of future cost trends. Each reporting period, changes in actuarial assumptions resulting from changes in actual claims experience and other trends are incorporated into the Company's workers’ compensation claims cost estimates. For fiscal 2023 and 2022, the Company has an aggregate maximum liability of $
47
As of May 31, 2023 and 2022, the Company had recorded current liabilities of $
With respect to PEO health insurance, the Company offers various health insurance plans that take the form of either fully insured guaranteed cost plans or fully insured insurance arrangements where the Company retains risk. A reserve for insurance arrangements where the Company retains risk is established to provide for the payment of claims in accordance with the Company’s service contract with the carrier. The claims liability includes estimates for reported losses, plus amounts for those claims incurred but not reported, and estimates of certain expenses associated with processing and settling the claims. The Company’s maximum individual claims liability was $
Estimating the ultimate cost of future claims is an uncertain and complex process based upon historical loss experience and accepted actuarial methods and assumptions. These reserves are subject to change due to multiple factors, including economic trends, changes in legal liability law, and damage awards, all of which could materially impact the reserves as reported in the consolidated financial statements. Accordingly, final claim settlements may vary from the present estimates, particularly with workers’ compensation insurance where those payments may not occur until well into the future. The Company regularly reviews the adequacy of its estimated insurance reserves. Adjustments to previously established reserves are reflected in the results of operations for the period in which the adjustment is identified. Such adjustments could be significant, reflecting any combination of new and adverse or favorable trends. Adjustments to previously established reserves were not material for fiscal 2023, 2022, or 2021.
Leases: The Company accounts for its leases under Accounting Standards Updates (“ASUs”) No. 2016-02. At contract inception, the Company determines if the new contractual arrangement is a lease or contains a leasing arrangement. If a contract contains a lease whose term is greater than one year, the Company evaluates whether it should be classified as an operating or a finance lease. Currently, all the Company’s leases have been classified as operating leases. Upon modification of a contract, the Company will reassess to determine if a contract is or contains a leasing arrangement.
The Company records lease liabilities based on the future estimated cash payments discounted over the lease term, defined as the non-cancellable time period of the lease, together with all the following:
Leases may also include options to terminate the arrangement or options to purchase the underlying lease property. The Company does not separate lease and non-lease components of contracts. Lease components provide the Company with the right to use an identified asset, which consist of the Company’s real estate properties and office equipment. Non-lease components consist primarily of maintenance services.
As an implicit discount rate is typically not readily determinable in the Company’s lease agreements, the Company uses its estimated secured incremental borrowing rate based on the information available at the lease commencement date in determining the present value of future lease payments. The incremental borrowing rate is determined using a portfolio approach utilizing publicly available information related to our unsecured borrowing rates. For certain leases with original terms of 12 months or less, the Company recognizes lease expense as incurred and does not recognize any lease liabilities. Short-term and long-term portions of operating lease liabilities are classified as other current liabilities and operating lease liabilities, respectively, in the Company’s Consolidated Balance Sheets.
48
An ROU asset is measured as the amount of the lease liability with adjustments, if applicable, for lease incentives, initial direct costs incurred by the Company, and lease prepayments made prior to or at lease commencement. ROU assets are classified as operating lease ROU assets, net of accumulated amortization, on the Company’s Consolidated Balance Sheets. The Company evaluates the carrying value of ROU assets if there are indicators of potential impairment and performs the analysis concurrent with the review of the recoverability of the related asset group. If the carrying value of the asset group is determined to not be fully recoverable and is in excess of its estimated fair value, the Company will record an impairment loss in its Consolidated Statements of Income and Comprehensive Income. The Company did
Fixed lease expense payments are recognized on a straight-line basis over the lease term. Variable lease payments vary because of changes in facts or circumstances occurring after the commencement date, other than the passage of time, and are often due to changes in an external market rate or the value of an index (e.g. Consumer Price Index). Variable lease payments are expensed as incurred in the Company’s Consolidated Statements of Income and Comprehensive Income.
Stock-based compensation costs: All stock-based awards to employees are recognized as compensation costs in the consolidated financial statements based on their fair values measured as of the date of grant. The Company estimates the fair value of stock option grants using a Black-Scholes option pricing model. This model requires various assumptions as inputs including expected volatility of the Paychex stock price and expected option life. Volatility is estimated based on a combination of historical volatility, using stock prices over a period equal to the expected option life, and implied market volatility. Expected option life is estimated based on historical exercise behavior. The Company periodically reassesses its assumptions as well as its choice of valuation model. The Company will reconsider use of this model if additional information becomes available in the future indicating that another model would provide a more accurate estimate of fair value or if characteristics of future grants would warrant such a change.
The fair value of stock awards is determined based on the stock price at the date of grant. For grants that do not accrue dividends or dividend equivalents, the fair value is the stock price reduced by the present value of estimated dividends over the vesting period or performance period.
The Company’s policy is to estimate forfeitures and only record compensation costs for those awards that are expected to vest. The assumptions for forfeitures are determined based on type of award and historical experience. Forfeiture assumptions are adjusted at the point in time a significant change is identified, with any adjustment recorded in the period of change, and the final adjustment at the end of the requisite service period to equal actual forfeitures.
The assumptions of volatility, expected option life, and forfeitures all require significant judgment and are subject to change in the future due to factors such as employee exercise behavior, stock price trends, and changes to type or provisions of stock-based awards. Any material change in one or more of these assumptions could have an impact on the estimated fair value of a future award.
Refer to Note E of this Item 8 for further discussion of the Company’s stock-based compensation plans.
Income taxes: The Company accounts for deferred taxes by recognizing deferred tax assets and liabilities for the expected future tax consequences of events that have been included in the consolidated financial statements or tax returns. Under this method, deferred tax assets and liabilities are determined based on the difference between the financial statement and tax basis of assets and liabilities, using enacted tax rates in effect for the fiscal year in which the differences are expected to reverse.
The Company also maintains a reserve for uncertain tax positions. The Company evaluates tax positions taken or expected to be taken in a tax return for recognition in its consolidated financial statements. Prior to recording the related tax benefit in the consolidated financial statements, the Company must conclude that tax positions will be more-likely-than-not to be sustained, assuming those positions will be examined by taxing authorities with full knowledge of all relevant information. The benefit recognized in the consolidated financial statements is the amount the Company expects to realize after examination by taxing authorities. If a tax position drops below the more-likely-than-not standard, the benefit can no longer be recognized. Assumptions, judgment, and the use of estimates are required in determining if the more-likely-than-not standard has been met when developing the provision for income taxes and in determining the expected benefit. A change in the assessment of the more-likely-than-not standard could materially impact the Company’s results of operations or financial position. Refer to Note K of this Item 8 for further discussion of the Company’s reserve for uncertain tax positions.
49
Use of estimates: The preparation of financial statements in conformity with U.S. generally accepted accounting principles requires management to make estimates, judgments, and assumptions that affect reported amounts of assets, liabilities, revenue, and expenses during the reporting period. Actual amounts and results could differ from these estimates.
Recently adopted accounting pronouncements: Effective
Recently issued accounting pronouncements: In October 2021, the Financial Accounting Standards Board (“FASB”) issued ASU No. 2021-08 “Business Combinations (Topic 805): Accounting for Contract Assets and Contract Liabilities from Contracts with Customers.” This ASU clarifies that an acquirer of a business should recognize and measure contract assets and contract liabilities in a business combination in accordance with ASC Topic 606, Revenue from Contracts with Customers. ASU No. 2021-08 is effective for public business entities for fiscal years, including interim periods within those fiscal years, beginning after December 15, 2022, with early application permitted. This ASU is applicable to the Company's fiscal year beginning June 1, 2023, and the impact of its adoption on the Company’s consolidated financial statements will depend on the contract assets and liabilities acquired in business combinations after that date.
Other recent authoritative guidance issued by the FASB (including technical corrections to the FASB ASC), the American Institute of Certified Public Accountants, and the Securities and Exchange Commission (“SEC”) did not or is not expected to have a material impact on the Company’s consolidated financial statements.
50
Note B — Service Revenue
Service revenue is primarily attributable to fees for providing services to the Company’s clients and is recognized when control of the contracted services is transferred to its clients, in an amount that reflects the consideration it expects to receive in exchange for such services. Insurance Solutions revenue is commissions earned on premiums collected and remitted to insurance carriers. The Company’s contracts generally do not contain specified contract periods and may be terminated by either party with
Based upon similar operational and economic characteristics, the Company’s service revenue is disaggregated by Management Solutions and PEO and Insurance Solutions as reported in the Company’s Consolidated Statements of Income and Comprehensive Income. The Company believes these revenue categories depict how the nature, amount, timing, and uncertainty of its revenue and cash flows are affected by economic factors.
Management Solutions Revenue
Management Solutions revenue is primarily derived from the Company’s integrated HCM and HR outsourcing solutions. Clients can select services on an á la carte basis or as part of various solution bundles. The Company’s offerings often leverage the information gathered in its base payroll processing service, allowing it to provide comprehensive outsourcing services covering the HCM spectrum. Management Solutions revenue is generally recognized over time as services are performed and the customer simultaneously receives and controls the benefits from these services.
Revenue earned from delivery service for the distribution of certain client payroll checks and reports is also included in Management Solutions revenue in the Company’s Consolidated Statements of Income and Comprehensive Income. Delivery service revenue is recognized at a point in time following the delivery of payroll checks, reports, quarter-end packages, and tax returns to the Company’s clients.
PEO and Insurance Solutions Revenue
PEO solutions are sold through the Company’s registered and licensed subsidiaries and offer businesses HCM and HR outsourcing solutions. The Company serves as a co-employer of its clients’ employees, offers health insurance coverage to client employees, and assumes the risks and rewards of workers’ compensation insurance and certain health insurance offerings. PEO Solutions revenue is recognized over time as the services are performed and the customer simultaneously receives and controls the benefits from these services. PEO Solutions revenue is reported net of certain pass-through costs billed and incurred, which include payroll wages, payroll taxes, including federal and state unemployment insurance, and health insurance premiums on guaranteed cost benefit plans. For workers’ compensation and health insurance plans where the Company retains risk, revenues and costs are recorded on a gross basis.
PEO pass-through costs netted within the PEO and Insurance Solutions revenue are as follows:
|
|
Year ended May 31, |
|
||||||||||||
In millions |
|
2023 |
|
|
2022 |
|
|
2021 |
|
||||||
Payroll wages and payroll taxes |
|
$ |
|
|
|
$ |
|
|
|
$ |
|
|
|||
State unemployment insurance (included in payroll wages and payroll taxes) |
|
$ |
|
|
|
$ |
|
|
|
$ |
|
|
|||
Guaranteed cost benefit plans |
|
$ |
|
|
|
$ |
|
|
|
$ |
|
|
|||
51
Insurance solutions are sold through the Company’s licensed insurance agency, Paychex Insurance Agency, Inc., which provides insurance through a variety of carriers, allowing companies to expand their employee benefit offerings at an affordable cost. Insurance offerings include property and casualty coverage such as workers’ compensation, business-owner policies, commercial auto, cybersecurity, and health and benefits coverage, including health, dental, vision, and life. Insurance Solutions revenue reflects commissions earned on remitted insurance services premiums billed and is recognized over time as services are performed and the customer simultaneously receives and controls the benefits from these services.
Contract Balances
The timing of revenue recognition for Management Solutions and PEO and Insurance Solutions is consistent with the invoicing of clients as they both occur during the respective client payroll period for which the services are provided. Therefore, the Company does not recognize a contract asset or liability resulting from the timing of revenue recognition and invoicing.
Payments received for certain of the Company’s service offerings for set-up fees are considered a material right. Therefore,
Changes in deferred revenue related to material rights that exceed one year were as follows:
|
|
Year ended May 31, |
|
|||||||
In millions |
|
2023 |
|
|
2022 |
|
||||
Balance, beginning of period |
|
$ |
|
|
|
$ |
|
|
||
Deferral of revenue |
|
|
|
|
|
|
|
|
||
Recognition of unearned revenue |
|
|
|
( |
) |
|
|
|
( |
) |
Balance, end of period |
|
$ |
|
|
|
$ |
|
|
||
Deferred revenue related to material rights is reported in the deferred revenue and other long-term liabilities line items on the Company’s Consolidated Balance Sheets. As of May 31, 2023, the Company expects to recognize $
Assets Recognized from the Costs to Obtain and Fulfill Contracts
The Company recognizes an asset for the incremental costs of obtaining a contract with a client if it is expected that the economic benefit and amortization period will be longer than one year. The Company also recognizes an asset for the costs to fulfill a contract with a client if the costs are specifically identifiable, generate or enhance resources used to satisfy future performance obligations, and are expected to be recovered.
Deferred costs to obtain and fulfill contracts are reported in the prepaid expenses and other current assets and long-term deferred costs line items on the Company’s Consolidated Balance Sheets. Amortization expense related to costs to obtain and fulfill a contract are included in cost of service revenue and selling, general and administrative expenses in the Company’s Consolidated Statements of Income and Comprehensive Income. Refer to Note A of this Item 8 for additional disclosures on our policies for assets recognized from the costs to obtain and fulfill contracts.
The Company regularly reviews its deferred costs for potential impairment and did
Changes in deferred costs to obtain and fulfill contracts were as follows:
Costs to fulfill contracts: |
|
|
|
|
|
|
|
|
||
|
|
Year ended May 31, |
|
|||||||
In millions |
|
2023 |
|
|
2022 |
|
||||
Balance, beginning of period |
|
$ |
|
|
|
$ |
|
|
||
Capitalization of costs |
|
|
|
|
|
|
|
|
||
Amortization |
|
|
|
( |
) |
|
|
|
( |
) |
Balance, end of period |
|
$ |
|
|
|
$ |
|
|
||
52
Costs to obtain contracts: |
|
|
|
|
|
|
|
|
||
|
|
Year ended May 31, |
|
|||||||
In millions |
|
2023 |
|
|
2022 |
|
||||
Balance, beginning of period |
|
$ |
|
|
|
$ |
|
|
||
Capitalization of costs |
|
|
|
|
|
|
|
|
||
Amortization |
|
|
|
( |
) |
|
|
|
( |
) |
Balance, end of period |
|
$ |
|
|
|
$ |
|
|
||
Note C — Basic and Diluted Earnings Per Share
Basic and diluted earnings per share were calculated as follows:
|
|
Year ended May 31, |
|
||||||||||||
In millions, except per share amounts |
|
2023 |
|
|
2022 |
|
|
2021 |
|
||||||
Basic earnings per share: |
|
|
|
|
|
|
|
|
|
|
|
|
|||
Net income |
|
$ |
|
|
|
$ |
|
|
|
$ |
|
|
|||
Weighted-average common shares outstanding |
|
|
|
|
|
|
|
|
|
|
|
|
|||
Basic earnings per share |
|
$ |
|
|
|
$ |
|
|
|
$ |
|
|
|||
Diluted earnings per share: |
|
|
|
|
|
|
|
|
|
|
|
|
|||
Net income |
|
$ |
|
|
|
$ |
|
|
|
$ |
|
|
|||
Weighted-average common shares outstanding |
|
|
|
|
|
|
|
|
|
|
|
|
|||
Dilutive effect of common share equivalents |
|
|
|
|
|
|
|
|
|
|
|
|
|||
Weighted-average common shares outstanding, assuming dilution |
|
|
|
|
|
|
|
|
|
|
|
|
|||
Diluted earnings per share |
|
$ |
|
|
|
$ |
|
|
|
$ |
|
|
|||
Weighted-average anti-dilutive common share equivalents |
|
|
|
|
|
|
|
|
|
|
|
|
|||
Weighted-average common share equivalents that had an anti-dilutive impact are excluded from the computation of diluted earnings per share.
Note D — Other Income/(Expense), Net
Other income/(expense), net, consisted of the following items:
|
|
Year ended May 31, |
|
||||||||||||
In millions |
|
2023 |
|
|
2022 |
|
|
2021 |
|
||||||
Interest income on corporate investments |
|
$ |
|
|
|
$ |
|
|
|
$ |
|
|
|||
Interest expense |
|
|
|
( |
) |
|
|
|
( |
) |
|
|
|
( |
) |
Other |
|
|
|
|
|
|
|
|
|
|
|
|
|||
Other income/(expense), net |
|
$ |
|
|
|
$ |
|
( |
) |
|
$ |
|
( |
) |
|
Note E — Stock-Based Compensation Plans
The Paychex, Inc. 2002 Stock Incentive Plan, as last amended and restated effective October 15, 2020 (the “2002 Plan”), authorizes grants of up to
All stock-based awards to employees are recognized as compensation costs in the consolidated financial statements based on their fair values measured as of the date of grant. These costs are recognized as an expense in the Consolidated Statements of Income and Comprehensive Income on a straight-line basis over the requisite service period and an increase in additional paid-in capital.
Stock-based compensation expense was $
As of May 31, 2023, the total unrecognized compensation cost related to all unvested stock-based awards was $
53
Black-Scholes fair value assumptions: The fair value of stock option grants was estimated at the date of grant using a Black-Scholes option pricing model.
|
Year ended May 31, |
||||||||||||||||
|
2023 |
|
2022 |
|
2021 |
||||||||||||
Risk-free interest rate |
|
|
|
% |
|
|
|
|
% |
|
|
|
|
% |
|||
Dividend yield |
|
|
|
% |
|
|
|
|
% |
|
|
|
|
% |
|||
Volatility factor |
|
|
|
|
|
|
|
|
|
|
|
|
|
|
|||
Expected option life in years |
|
|
|
|
|
|
|
|
|
|
|
|
|
|
|||
Weighted-average grant-date |
$ |
|
|
|
|
$ |
|
|
|
|
$ |
|
|
|
|||
Risk-free interest rates are yields for zero coupon U.S. Treasury notes maturing approximately at the end of the expected option life. The estimated volatility factor is based on a combination of historical volatility, using stock prices over a period equal to the expected option life, and implied market volatility. The expected option life is based on historical exercise behavior.
Stock options: Stock options entitle the holder to purchase, at the end of the vesting term, a specified number of shares of Paychex common stock at an exercise price per share equal to the closing market price of the common stock on the date of grant. All stock options have a contractual life of
The following table summarizes stock option activity for fiscal 2023:
|
|
|
|
|
|
|
|
|
Weighted- |
|
|
|
|
|
||||
|
|
|
|
|
Weighted- |
|
|
average |
|
|
|
|
|
|||||
|
|
Shares |
|
|
average |
|
|
remaining |
|
|
Aggregate |
|
||||||
|
|
subject |
|
|
exercise price |
|
|
contractual |
|
|
intrinsic |
|
||||||
In millions, except per share amounts |
|
to options |
|
|
per share |
|
|
term (years) |
|
|
value(1) |
|
||||||
Outstanding as of May 31, 2022 |
|
|
|
|
$ |
|
|
|
|
|
|
|
|
|
||||
Granted |
|
|
|
|
$ |
|
|
|
|
|
|
|
|
|
||||
Exercised |
|
|
( |
) |
|
$ |
|
|
|
|
|
|
|
|
|
|||
Forfeited |
|
|
( |
) |
|
$ |
|
|
|
|
|
|
|
|
|
|||
Outstanding as of May 31, 2023 |
|
|
|
|
$ |
|
|
|
|
|
|
$ |
|
|
||||
Exercisable as of May 31, 2023 |
|
|
|
|
$ |
|
|
|
|
|
|
$ |
|
|
||||
Other information pertaining to stock option grants is as follows:
|
|
Year ended May 31, |
|
||||||||||
In millions |
|
2023 |
|
2022 |
|
2021 |
|
||||||
Total intrinsic value of stock options exercised |
|
$ |
|
|
$ |
|
|
$ |
|
|
|||
Total grant-date fair value of stock options vested |
|
$ |
|
|
$ |
|
|
$ |
|
|
|||
Restricted Stock Units (“RSUs”): The Board grants RSUs to certain executive and non-executive employees and outside directors. An RSU is an agreement to issue shares at the time of vesting with no associated exercise cost for the recipient. For each unit granted, the holder will receive one share of Paychex common stock at the time of vesting. If the recipient does not vest in the shares due to leaving Paychex, all shares or units of RSUs, and any dividends accrued thereon, when applicable, will be forfeited and returned to the Company.
54
Time-based RSUs: Time-based RSUs granted to executives vest per annum over
Performance-based RSUs: Performance-based RSUs primarily have a
The following table summarizes RSU activity for fiscal 2023:
|
|
|
|
|
Weighted- |
|
|
|
|
|
Weighted- |
|
||||||
|
|
|
|
|
average |
|
|
|
|
|
average |
|
||||||
|
|
Time- |
|
|
grant-date |
|
|
Performance- |
|
|
grant-date |
|
||||||
|
|
Based |
|
|
fair value |
|
|
based |
|
|
fair value |
|
||||||
In millions, except per share amounts |
|
RSUs |
|
|
per share |
|
|
RSUs |
|
|
per share |
|
||||||
Nonvested as of May 31, 2022 |
|
|
|
|
$ |
|
|
|
|
|
|
$ |
|
|
||||
Granted (1) |
|
|
|
|
$ |
|
|
|
|
|
|
$ |
|
|
||||
Vested |
|
|
( |
) |
|
$ |
|
|
|
|
( |
) |
|
$ |
|
|
||
Forfeited |
|
|
( |
) |
|
$ |
|
|
|
|
( |
) |
|
$ |
|
|
||
Nonvested as of May 31, 2023 |
|
|
|
|
$ |
|
|
|
|
|
|
$ |
|
|
||||
Other information pertaining to RSUs is as follows:
|
|
Year ended May 31, |
|
||||||||||||
In millions, except per share amounts |
|
2023 |
|
|
2022 |
|
|
2021 |
|
||||||
Time-based RSUs: |
|
|
|
|
|
|
|
|
|
|
|
|
|||
Weighted-average grant-date fair value per share of RSUs granted |
|
$ |
|
|
|
$ |
|
|
|
$ |
|
|
|||
Weighted-average remaining vesting period (years)(1) |
|
|
|
|
|
|
|
|
|
|
|
|
|||
Total intrinsic value of RSUs vested |
|
$ |
|
|
|
$ |
|
|
|
$ |
|
|
|||
Aggregate intrinsic value of nonvested RSUs(2) |
|
$ |
|
|
|
$ |
|
|
|
$ |
|
|
|||
Total grant-date fair value of RSUs vested |
|
$ |
|
|
|
$ |
|
|
|
$ |
|
|
|||
|
|
|
|
|
|
|
|
|
|
|
|
|
|||
Performance-based RSUs(3): |
|
|
|
|
|
|
|
|
|
|
|
|
|||
Weighted-average grant-date fair value per share of RSUs granted |
|
$ |
|
|
|
$ |
|
|
|
$ |
|
|
|||
Weighted-average remaining vesting period (years)(1) |
|
|
|
|
|
|
|
|
|
|
|
|
|||
Total intrinsic value of RSUs vested |
|
$ |
|
|
|
$ |
|
— |
|
|
$ |
|
— |
|
|
Aggregate intrinsic value of nonvested RSUs(2) |
|
$ |
|
|
|
$ |
|
|
|
$ |
|
|
|||
Total grant-date fair value of RSUs vested |
|
$ |
|
|
|
$ |
|
— |
|
|
$ |
|
— |
|
|
Restricted stock awards: The Board approved grants of restricted stock awards to the Company’s executives and outside directors prior to fiscal 2023. All shares underlying awards of restricted stock are restricted in that they are not transferable until they vest. Recipients of the restricted stock earn dividends, which are paid to the recipient at the time the awards vest. If the recipient does not vest in the shares due to leaving Paychex, all shares of restricted stock, and the dividends accrued thereon, when applicable, will be forfeited and returned to the Company.
55
Time-based restricted stock awards: Time-based restricted stock awards granted to executives vest -third per annum. Time-based restricted stock awards granted to outside directors vest on the
Performance-based restricted stock awards: Performance-based restricted stock awards primarily have a
The following table summarizes time-based and performance-based restricted stock award activity for fiscal 2023:
|
|
|
|
|
Weighted- |
|
|
|
|
|
Weighted- |
|
||||||
|
|
|
|
|
average |
|
|
|
|
|
average |
|
||||||
|
|
|
|
|
grant-date |
|
|
Performance- |
|
|
grant-date |
|
||||||
|
|
Time-based |
|
|
fair value |
|
|
based |
|
|
fair value |
|
||||||
In millions, except per share amounts |
|
shares |
|
|
per share |
|
|
shares |
|
|
per share |
|
||||||
Nonvested as of May 31, 2022 |
|
|
|
|
$ |
|
|
|
|
|
|
$ |
|
|
||||
Vested |
|
|
( |
) |
|
$ |
|
|
|
|
( |
) |
|
$ |
|
|
||
Nonvested as of May 31, 2023 |
|
|
|
|
$ |
|
|
|
|
|
|
$ |
|
|
||||
Other information pertaining to time-based and performance-based restricted stock awards is as follows:
|
|
Year ended May 31, |
|
||||||||||||
In millions, except per share amounts |
|
2023 |
|
|
2022 |
|
|
2021 |
|
||||||
Weighted-average grant-date fair value per share of time-based shares granted |
|
$ |
|
|
|
$ |
|
|
|
$ |
|
|
|||
Total grant-date fair value of time-based restricted stock vested |
|
$ |
|
|
|
$ |
|
|
|
$ |
|
|
|||
Weighted-average grant-date fair value per share of performance-based shares |
|
$ |
|
|
|
$ |
|
|
|
$ |
|
|
|||
Total grant-date fair value of performance-based restricted stock vested |
|
$ |
|
|
|
$ |
|
|
|
$ |
|
|
|||
Long-term Incentive Plan (“LTIP”): In July 2016, the Board approved an LTIP award comprised of both performance-based non-qualified stock options and performance-based restricted stock awards. This award was granted to executives down to the vice president level with vesting dependent on achievement against long-term strategic and financial objectives. Total stock options and restricted shares earned were based on achievement against pre-established targets for fiscal 2020, which vested in fiscal 2021.
The following table summarizes LTIP performance-based stock option activity for fiscal 2023:
|
|
|
|
|
|
|
|
|
Weighted- |
|
|
|
|
|
||||
|
|
|
|
|
Weighted- |
|
|
average |
|
|
|
|
|
|||||
|
|
Shares |
|
|
average |
|
|
remaining |
|
|
Aggregate |
|
||||||
|
|
subject |
|
|
exercise price |
|
|
contractual |
|
|
intrinsic |
|
||||||
In millions, except per share amounts |
|
to options |
|
|
per share |
|
|
term (years) |
|
|
value(1) |
|
||||||
Outstanding as of May 31, 2022 |
|
|
|
|
$ |
|
|
|
|
|
|
|
|
|
||||
Exercised |
|
|
( |
) |
|
$ |
|
|
|
|
|
|
|
|
|
|||
Outstanding as of May 31, 2023 |
|
|
|
|
$ |
|
|
|
|
|
|
$ |
|
|
||||
Exercisable as of May 31, 2023 |
|
|
|
|
$ |
|
|
|
|
|
|
$ |
|
|
||||
56
Other information pertaining to LTIP performance-based stock options is as follows:
|
|
Year ended May 31, |
|
||||||||||
In millions |
|
2023 |
|
2022 |
|
2021 |
|
||||||
Total intrinsic value of stock options exercised |
|
$ |
|
|
$ |
|
|
$ |
|
|
|||
Total grant-date fair value of stock options vested |
|
$ |
|
— |
|
$ |
|
— |
|
$ |
|
|
|
Non-compensatory employee benefit plan: The Company offers a qualified Employee Stock Purchase Plan (“ESPP”) to all employees. The Company’s common stock can be purchased through a payroll deduction at a discount to the market price. The qualified ESPP allows for a discount of up to
Note F — Funds Held for Clients and Corporate Investments
Funds held for clients and corporate investments are as follows:
|
|
May 31, 2023 |
|
|||||||||||||||||
|
|
|
|
|
|
Gross |
|
|
Gross |
|
|
|
|
|
||||||
|
|
Amortized |
|
|
unrealized |
|
|
unrealized |
|
|
Fair |
|
||||||||
In millions |
|
cost |
|
|
gains |
|
|
losses |
|
|
value |
|
||||||||
Type of issue: |
|
|
|
|
|
|
|
|
|
|
|
|
|
|
|
|
||||
Funds held for clients' money market securities and other |
|
$ |
|
|
|
$ |
|
— |
|
|
$ |
|
— |
|
|
$ |
|
|
||
AFS securities: |
|
|
|
|
|
|
|
|
|
|
|
|
|
|
|
|
||||
Asset-backed securities |
|
|
|
|
|
|
|
— |
|
|
|
|
( |
) |
|
|
|
|
||
Corporate bonds |
|
|
|
|
|
|
|
|
|
|
|
( |
) |
|
|
|
|
|||
Municipal bonds |
|
|
|
|
|
|
|
|
|
|
|
( |
) |
|
|
|
|
|||
U.S. government agency and treasury securities |
|
|
|
|
|
|
|
|
|
|
|
( |
) |
|
|
|
|
|||
Variable rate demand notes |
|
|
|
|
|
|
|
— |
|
|
|
|
— |
|
|
|
|
|
||
Total AFS securities |
|
|
|
|
|
|
|
|
|
|
|
( |
) |
|
|
|
|
|||
Other |
|
|
|
|
|
|
|
|
|
|
|
( |
) |
|
|
|
|
|||
Total funds held for clients and corporate investments |
|
$ |
|
|
|
$ |
|
|
|
$ |
|
( |
) |
|
$ |
|
|
|||
|
|
May 31, 2022 |
|
|||||||||||||||||
|
|
|
|
|
|
Gross |
|
|
Gross |
|
|
|
|
|
||||||
|
|
Amortized |
|
|
unrealized |
|
|
unrealized |
|
|
Fair |
|
||||||||
In millions |
|
cost |
|
|
gains |
|
|
losses |
|
|
value |
|
||||||||
Type of issue: |
|
|
|
|
|
|
|
|
|
|
|
|
|
|
|
|
||||
Funds held for clients' money market securities and other |
|
$ |
|
|
|
$ |
|
— |
|
|
$ |
|
— |
|
|
$ |
|
|
||
AFS securities: |
|
|
|
|
|
|
|
|
|
|
|
|
|
|
|
|
||||
Asset-backed securities |
|
|
|
|
|
|
|
|
|
|
|
( |
) |
|
|
|
|
|||
Corporate bonds |
|
|
|
|
|
|
|
|
|
|
|
( |
) |
|
|
|
|
|||
Municipal bonds |
|
|
|
|
|
|
|
|
|
|
|
( |
) |
|
|
|
|
|||
U.S. government agency and treasury securities |
|
|
|
|
|
|
|
|
|
|
|
( |
) |
|
|
|
|
|||
Variable rate demand notes |
|
|
|
|
|
|
|
— |
|
|
|
|
— |
|
|
|
|
|
||
Total AFS securities |
|
|
|
|
|
|
|
|
|
|
|
( |
) |
|
|
|
|
|||
Other |
|
|
|
|
|
|
|
|
|
|
|
( |
) |
|
|
|
|
|||
Total funds held for clients and corporate investments |
|
$ |
|
|
|
$ |
|
|
|
$ |
|
( |
) |
|
$ |
|
|
|||
Included in funds held for clients’ money market securities and other restricted cash equivalents as of May 31, 2023 were bank demand deposit accounts and money market funds.
57
Included in asset-backed securities as of May 31, 2023 were investment-grade securities primarily collateralized by fixed-rate auto loans and credit card receivables and all have credit ratings of AAA. The primary risk associated with these securities is the collection of the underlying receivables. Collateral on these asset-backed securities has performed as expected through May 31, 2023.
Included in corporate bonds as of May 31, 2023 were investment-grade securities covering a wide range of issuers, industries, and sectors and primarily carry credit ratings of A or better and having maturities ranging from
Included in municipal bonds as of May 31, 2023 were general obligation bonds and revenue bonds carrying credit ratings of AA or better and have maturities ranging from
A substantial portion of our portfolios are invested in high credit quality securities with ratings of AA or higher, and A-1/P-1 ratings on short-term securities.
The classification of funds held for clients and corporate investments on the Consolidated Balance Sheets is as follows:
|
|
May 31, |
|
|||||||
In millions |
|
2023 |
|
|
2022 |
|
||||
Funds held for clients |
|
$ |
|
|
|
$ |
|
|
||
Corporate investments |
|
|
|
|
|
|
|
|
||
Long-term corporate investments |
|
|
|
|
|
|
|
|
||
Total funds held for clients and corporate investments |
|
$ |
|
|
|
$ |
|
|
||
Funds held for clients’ money market securities and other restricted cash equivalents is collected from clients before due dates for payroll tax administration services and employee payment services and is invested until remitted to the applicable tax or regulatory agencies or client employees. Based upon the Company’s intent and its contractual obligation to clients, these funds are considered restricted until they are remitted to fund these client obligations.
The Company’s AFS securities reflected net unrealized losses of $
|
May 31, 2023 |
|
||||||||||||||||||||||
|
Securities in an unrealized |
|
Securities in an unrealized |
|
Total |
|
||||||||||||||||||
|
Gross |
|
|
|
|
Gross |
|
|
|
|
Gross |
|
|
|
|
|||||||||
|
unrealized |
|
Fair |
|
unrealized |
|
Fair |
|
unrealized |
|
Fair |
|
||||||||||||
In millions |
losses |
|
value |
|
losses |
|
value |
|
losses |
|
value |
|
||||||||||||
Type of issue: |
|
|
|
|
|
|
|
|
|
|
|
|
|
|
|
|
|
|
||||||
Asset-backed securities |
$ |
|
( |
) |
$ |
|
|
$ |
|
( |
) |
$ |
|
|
$ |
|
( | ) |
$ |
|
|
|||
Corporate bonds |
|
|
( |
) |
|
|
|
|
|
( |
) |
|
|
|
|
|
( | ) |
|
|
|
|||
Municipal bonds |
|
|
( |
) |
|
|
|
|
|
( |
) |
|
|
|
|
|
( |
) |
|
|
|
|||
U.S. government agency and treasury securities |
|
|
( |
) |
|
|
|
|
|
( |
) |
|
|
|
|
|
( |
) |
|
|
|
|||
Total |
$ |
|
( |
) |
$ |
|
|
$ |
|
( |
) |
$ |
|
|
$ |
|
( |
) |
$ |
|
|
|||
58
|
May 31, 2022 |
|
||||||||||||||||||||||
|
Securities in an unrealized |
|
Securities in an unrealized |
|
Total |
|
||||||||||||||||||
|
Gross |
|
|
|
|
Gross |
|
|
|
|
Gross |
|
|
|
|
|||||||||
|
unrealized |
|
Fair |
|
unrealized |
|
Fair |
|
unrealized |
|
Fair |
|
||||||||||||
In millions |
losses |
|
value |
|
losses |
|
value |
|
losses |
|
value |
|
||||||||||||
Type of issue: |
|
|
|
|
|
|
|
|
|
|
|
|
|
|
|
|
|
|
||||||
Asset-backed securities |
$ |
|
( |
) |
$ |
|
|
$ |
|
( |
) |
$ |
|
|
$ |
|
( | ) |
$ |
|
|
|||
Corporate bonds |
|
|
( |
) |
|
|
|
|
|
( |
) |
|
|
|
|
|
( | ) |
|
|
|
|||
Municipal bonds |
|
|
( |
) |
|
|
|
|
|
( |
) |
|
|
|
|
|
( | ) |
|
|
|
|||
U.S. government agency and treasury securities |
|
|
( |
) |
|
|
|
|
|
( |
) |
|
|
|
|
|
( |
) |
|
|
|
|||
Total |
$ |
|
( |
) |
$ |
|
|
$ |
|
( |
) |
$ |
|
|
$ |
|
( |
) |
$ |
|
|
|||
The Company regularly reviews its investment portfolios to determine if any investment is impaired due to changes in credit risk or other potential valuation concerns. The Company believes the investments held as of May 31, 2023 that had gross unrealized losses of $
Realized gains and losses from the sale of AFS securities were as follows:
|
|
Year ended May 31, |
|
||||||||||||
In millions |
|
2023 |
|
|
2022 |
|
|
2021 |
|
||||||
Gross realized gains |
|
$ |
|
|
|
$ |
|
|
|
$ |
|
|
|||
Gross realized losses |
|
|
|
( |
) |
|
|
|
|
|
|
|
— |
|
|
Net realized (losses)/gains |
|
$ |
|
( |
) |
|
$ |
|
|
|
$ |
|
|
||
The amortized cost and fair value of AFS securities that had stated maturities as of May 31, 2023 are shown below by expected maturity.
|
|
May 31, 2023 |
|
|||||||
|
|
Amortized |
|
|
Fair |
|
||||
In millions |
|
cost |
|
|
value |
|
||||
Maturity date: |
|
|
|
|
|
|
|
|
||
Due in one year or less |
|
$ |
|
|
|
$ |
|
|
||
Due after one year through three years |
|
|
|
|
|
|
|
|
||
Due after three years through five years |
|
|
|
|
|
|
|
|
||
Due after five years |
|
|
|
|
|
|
|
|
||
Total |
|
$ |
|
|
|
$ |
|
|
||
VRDNs are primarily categorized as due after five years in the table above as the contractual maturities on these securities are typically
59
Note G — Fair Value Measurements
Fair value is defined as the price that would be received to sell an asset or paid to transfer a liability (an exit price) in an orderly transaction between market participants at the measurement date. The accounting standards related to fair value measurements include a hierarchy for information and valuations used in measuring fair value that is broken down into three levels based on reliability, as follows:
The carrying values of cash and cash equivalents, restricted cash and restricted cash equivalents, accounts receivable, net of allowance for credit losses, PEO unbilled receivables, net of advance collections, accounts payable and short-term borrowings, when used by the Company, approximate fair value due to the short maturities of these instruments. Marketable securities included in funds held for clients and corporate investments consist primarily of securities classified as AFS and are recorded at fair value on a recurring basis.
The Company’s financial assets and liabilities measured at fair value on a recurring basis were as follows:
|
|
May 31, 2023 |
|
|||||||||||||||||
|
|
|
|
|
|
|
|
|
|
|
|
|
|
|
|
|
||||
|
|
|
|
|
|
Quoted |
|
|
Significant |
|
|
|
|
|
||||||
|
|
|
|
|
|
prices in |
|
|
other |
|
|
Significant |
|
|||||||
|
|
Carrying |
|
|
active |
|
|
observable |
|
|
unobservable |
|
||||||||
|
|
value |
|
|
markets |
|
|
inputs |
|
|
inputs |
|
||||||||
In millions |
|
(Fair value) |
|
|
(Level 1) |
|
|
(Level 2) |
|
|
(Level 3) |
|
||||||||
Assets: |
|
|
|
|
|
|
|
|
|
|
|
|
|
|
|
|
||||
Restricted and unrestricted cash equivalents: |
|
|
|
|
|
|
|
|
|
|
|
|
|
|
|
|
||||
Money market securities |
|
|
|
|
|
|
|
|
|
|
|
— |
|
|
|
|
— |
|
||
Total restricted and unrestricted cash equivalents |
|
$ |
|
|
|
$ |
|
|
|
$ |
|
— |
|
|
$ |
|
— |
|
||
AFS securities: |
|
|
|
|
|
|
|
|
|
|
|
|
|
|
|
|
||||
Asset-backed securities |
|
$ |
|
|
|
$ |
|
— |
|
|
$ |
|
|
|
$ |
|
— |
|
||
Corporate bonds |
|
|
|
|
|
|
|
— |
|
|
|
|
|
|
|
|
— |
|
||
Municipal bonds |
|
|
|
|
|
|
|
— |
|
|
|
|
|
|
|
|
— |
|
||
U.S. government agency and treasury securities |
|
|
|
|
|
|
|
— |
|
|
|
|
|
|
|
|
— |
|
||
VRDNs |
|
|
|
|
|
|
|
— |
|
|
|
|
|
|
|
|
— |
|
||
Total AFS securities |
|
$ |
|
|
|
$ |
|
— |
|
|
$ |
|
|
|
$ |
|
— |
|
||
Other |
|
$ |
|
|
|
$ |
|
|
|
$ |
|
— |
|
|
$ |
|
— |
|
||
Liabilities: |
|
|
|
|
|
|
|
|
|
|
|
|
|
|
|
|
||||
Other long-term liabilities |
|
$ |
|
|
|
$ |
|
|
|
$ |
|
— |
|
|
$ |
|
— |
|
||
60
|
|
May 31, 2022 |
|
|||||||||||||||||
|
|
|
|
|
|
|
|
|
|
|
|
|
|
|
|
|
||||
|
|
|
|
|
|
Quoted |
|
|
Significant |
|
|
|
|
|
||||||
|
|
|
|
|
|
prices in |
|
|
other |
|
|
Significant |
|
|||||||
|
|
Carrying |
|
|
active |
|
|
observable |
|
|
unobservable |
|
||||||||
|
|
value |
|
|
markets |
|
|
inputs |
|
|
inputs |
|
||||||||
In millions |
|
(Fair value) |
|
|
(Level 1) |
|
|
(Level 2) |
|
|
(Level 3) |
|
||||||||
Assets: |
|
|
|
|
|
|
|
|
|
|
|
|
|
|
|
|
||||
Restricted and unrestricted cash equivalents: |
|
|
|
|
|
|
|
|
|
|
|
|
|
|
|
|
||||
Commercial paper |
|
$ |
|
|
|
$ |
|
— |
|
|
$ |
|
|
|
$ |
|
— |
|
||
Time deposits |
|
|
|
|
|
|
|
— |
|
|
|
|
|
|
|
|
— |
|
||
VRDNs |
|
|
|
|
|
|
|
— |
|
|
|
|
|
|
|
|
— |
|
||
Money market securities |
|
$ |
|
|
|
$ |
|
|
|
$ |
|
— |
|
|
$ |
|
— |
|
||
Total restricted and unrestricted cash equivalents |
|
$ |
|
|
|
$ |
|
|
|
$ |
|
|
|
$ |
|
— |
|
|||
AFS securities: |
|
|
|
|
|
|
|
|
|
|
|
|
|
|
|
|
||||
Asset-backed securities |
|
$ |
|
|
|
$ |
|
— |
|
|
$ |
|
|
|
$ |
|
— |
|
||
Corporate bonds |
|
|
|
|
|
|
|
— |
|
|
|
|
|
|
|
|
— |
|
||
Municipal bonds |
|
|
|
|
|
|
|
— |
|
|
|
|
|
|
|
|
— |
|
||
U.S. government agency and treasury securities |
|
|
|
|
|
|
|
— |
|
|
|
|
|
|
|
|
— |
|
||
VRDNs |
|
|
|
|
|
|
|
— |
|
|
|
|
|
|
|
|
— |
|
||
Total AFS securities |
|
$ |
|
|
|
$ |
|
— |
|
|
$ |
|
|
|
$ |
|
— |
|
||
Other |
|
$ |
|
|
|
$ |
|
|
|
$ |
|
— |
|
|
$ |
|
— |
|
||
Liabilities: |
|
|
|
|
|
|
|
|
|
|
|
|
|
|
|
|
||||
Other long-term liabilities |
|
$ |
|
|
|
$ |
|
|
|
$ |
|
— |
|
|
$ |
|
— |
|
||
In determining the fair value of its assets and liabilities, the Company predominately uses the market approach. Money market securities, which are cash equivalents, are considered Level 1 investments as they are valued based on quoted market prices in active markets. Cash equivalents also include commercial paper, time deposits, and VRDNs which are considered Level 2 investments as they are valued based on similar, but not identical, instruments in active markets. AFS securities, including asset-backed securities, corporate bonds, municipal bonds, U.S. government agency securities, and VRDNs, when held by the Company, are included in Level 2 and are valued utilizing inputs obtained from an independent pricing service. To determine the fair value of the Company’s Level 2 AFS securities, the independent pricing service uses a variety of inputs, including benchmark yields, reported trades, non-binding broker/dealer quotes, issuer spreads, two-sided markets, benchmark securities, bids, offers, reference data, new issue data, and monthly payment information. The Company has not adjusted the prices obtained from the independent pricing service because it believes that they are appropriately valued.
Assets included as other are mutual fund investments, consisting of participants’ eligible deferral contributions under the Company’s non-qualified and unfunded deferred compensation plans. The related liability is reported as other long-term liabilities. The mutual funds are considered Level 1 investments as they are valued based on quoted market prices in active markets.
The Company’s long-term borrowings are accounted for on a historical cost basis. As of May 31, 2023 and May 31, 2022, the fair value of long-term borrowings, net of debt issuance costs was $
The Company’s long-term borrowings are not traded in active markets, and as a result, its fair values were estimated using a market approach employing Level 2 valuation inputs, including borrowing rates the Company believes are currently available based on loans with similar terms and maturities.
The preceding methods described may produce a fair value calculation that may not be indicative of net realizable value or reflective of future fair values. Furthermore, although the Company believes its valuation methods are appropriate and consistent with other market participants, the use of different methodologies or assumptions to determine the fair value of certain financial instruments could result in a different fair value measurement at the reporting date.
61
Note H — Leases
The Company’s lease portfolio consists primarily of operating leases for office space and has remaining terms from less than
Supplemental balance sheet information related to the Company’s leases were as follows:
|
|
May 31, |
|
|||||||
$ in millions |
|
2023 |
|
|
2022 |
|
||||
Operating lease right-of-use assets, net of accumulated amortization |
|
$ |
|
|
|
$ |
|
|
||
(1) |
|
|
|
|
|
|
|
|
||
Operating lease liabilities, non-current |
|
|
|
|
|
|
|
|
||
|
|
|
|
|
|
|
|
|
||
Weighted average remaining lease term (in years) |
|
|
|
|
|
|
|
|
||
Weighted average discount rate |
|
|
|
% |
|
|
|
% |
||
The components of lease expense were as follows:
|
|
Year ended May 31, |
|
||||||||||||
In millions |
|
2023 |
|
|
2022 |
|
|
|
2021 |
|
|||||
Fixed payment operating lease expense |
|
$ |
|
|
|
$ |
|
|
|
$ |
|
|
|||
Variable payment operating lease expense |
|
|
|
|
|
|
|
|
|
|
|
|
|||
Short-term lease expense |
|
|
|
|
|
|
|
- |
|
|
|
|
|
||
During the three months ended August 31, 2020, the Company ceased the use of certain leased property and accelerated the amortization of operating lease ROU assets, resulting in an additional $
Supplemental cash flow information related to the Company’s leases were as follows:
|
|
Year ended May 31, |
|
||||||||||||
In millions |
|
2023 |
|
|
2022 |
|
|
|
2021 |
|
|||||
Cash paid for amounts included in the measurement of lease liabilities |
|
$ |
|
|
|
$ |
|
|
|
$ |
|
|
|||
Amortization of ROU assets |
|
|
|
|
|
|
|
|
|
|
|
|
|||
ROU assets obtained in exchange for new operating lease liabilities |
|
|
|
|
|
|
|
|
|
|
|
|
|||
Lease incentives received in the form of tenant allowances and free rent |
|
|
|
|
|
|
|
|
|
|
|
|
|||
62
Future lease payments are as follows:
|
|
May 31, |
|
||
In millions |
|
2023 |
|
||
2023 |
|
$ |
|
|
|
2024 |
|
|
|
|
|
2025 |
|
|
|
|
|
2026 |
|
|
|
|
|
2027 |
|
|
|
|
|
Thereafter |
|
|
|
|
|
Total future lease payments |
|
|
|
|
|
Less: imputed interest |
|
|
|
|
|
Total operating lease liabilities |
|
$ |
|
|
|
Current portion |
|
$ |
|
|
|
Non-current portion |
|
$ |
|
|
|
As of May 31, 2023, the Company has entered into
Note I — Property and Equipment, Net of Accumulated Depreciation
The components of property and equipment, at cost, consisted of the following:
|
|
May 31, |
|
|||||||
In millions |
|
2023 |
|
|
2022 |
|
||||
Land and improvements |
|
$ |
|
|
|
$ |
|
|
||
Buildings and improvements |
|
|
|
|
|
|
|
|
||
Data processing equipment |
|
|
|
|
|
|
|
|
||
Software (1) |
|
|
|
|
|
|
|
|
||
Furniture, fixtures, and equipment |
|
|
|
|
|
|
|
|
||
Leasehold improvements |
|
|
|
|
|
|
|
|
||
Construction in progress (1) |
|
|
|
|
|
|
|
|
||
Total property and equipment, gross |
|
|
|
|
|
|
|
|
||
Less: Accumulated depreciation |
|
|
|
|
|
|
|
|
||
Property and equipment, net of accumulated depreciation |
|
$ |
|
|
|
$ |
|
|
||
Depreciation expense was $
Note J — Goodwill and Intangible Assets, Net of Accumulated Amortization
Goodwill and changes in goodwill as of and for the years ended May 31, 2023 and May 31, 2022 were as follows:
|
|
May 31, |
|
|||||||
In millions |
|
2023 |
|
|
2022 |
|
||||
Balance, beginning of fiscal year |
|
$ |
|
|
|
$ |
|
|
||
Changes during the period: |
|
|
|
|
|
|
|
|
||
Goodwill acquired |
|
|
|
|
|
|
|
|
||
Currency translation adjustment |
|
|
|
( |
) |
|
|
|
( |
) |
Balance, end of fiscal year |
|
$ |
|
|
|
$ |
|
|
||
63
The Company had certain intangible assets on its Consolidated Balance Sheets. The components of intangible assets, at cost, consisted of the following:
|
|
May 31, |
|
|||||||
In millions |
|
2023 |
|
|
2022 |
|
||||
Client lists |
|
$ |
|
|
|
$ |
|
|
||
Other intangible assets |
|
|
|
|
|
|
|
|
||
Total intangible assets, gross |
|
|
|
|
|
|
|
|
||
Less: Accumulated amortization |
|
|
|
|
|
|
|
|
||
Intangible assets, net of accumulated amortization |
|
$ |
|
|
|
$ |
|
|
||
During fiscal 2023, the Company acquired customer lists with a weighted-average amortization period of
Amortization expense relating to intangible assets was $
The Company did
The estimated amortization expense for the next five fiscal years relating to intangible asset balances is as follows:
In millions |
|
|
Estimated |
|
|
Year ending May 31, |
|
expense |
|
||
2024 |
|
$ |
|
|
|
2025 |
|
|
|
|
|
2026 |
|
|
|
|
|
2027 |
|
|
|
|
|
2028 |
|
|
|
|
|
Note K — Income Taxes
The components of deferred tax assets and liabilities are as follows:
|
May 31, |
|
||||||
In millions |
2023 |
|
2022 |
|
||||
Deferred tax assets: |
|
|
|
|
|
|
||
Compensation and employee benefit liabilities |
$ |
|
|
$ |
|
|
||
Other current liabilities |
|
|
|
|
|
|
||
Tax credit carry forward |
|
|
|
|
|
|
||
Stock-based compensation |
|
|
|
|
|
|
||
Unrealized losses on available-for-sale securities |
|
|
|
|
|
|
||
Capitalization of research and development |
|
|
|
|
|
— |
|
|
Leases |
|
|
|
|
|
|
||
Net operating loss (“NOL”) carry forwards |
|
|
|
|
|
|
||
Tax benefit of uncertain tax positions |
|
|
|
|
|
|
||
Gross deferred tax assets |
|
|
|
|
|
|
||
Deferred tax liabilities: |
|
|
|
|
|
|
||
Deferred contract costs |
|
|
|
|
|
|
||
Capitalized software |
|
|
|
|
|
|
||
Depreciation |
|
|
|
|
|
|
||
Goodwill and intangible assets |
|
|
|
|
|
|
||
Operating lease right-of-use assets |
|
|
|
|
|
|
||
Other |
|
|
|
|
|
|
||
Gross deferred tax liabilities |
|
|
|
|
|
|
||
Net deferred tax liability |
$ |
|
( |
) |
$ |
|
( |
) |
64
The deferred tax asset related to NOL carry forwards is comprised of $
The components of the provision for income taxes are as follows:
|
Year ended May 31, |
|
||||||||||
In millions |
2023 |
|
2022 |
|
2021 |
|
||||||
Current: |
|
|
|
|
|
|
|
|
|
|||
Federal |
$ |
|
|
$ |
|
|
$ |
|
|
|||
State |
|
|
|
|
|
|
|
|
|
|||
Non-U.S. |
|
|
( |
) |
|
|
( |
) |
|
|
|
|
Total current |
|
|
|
|
|
|
|
|
|
|||
Deferred: |
|
|
|
|
|
|
|
|
|
|||
Federal |
|
|
( |
) |
|
|
|
|
|
( |
) |
|
State |
|
|
( |
) |
|
|
|
|
|
( |
) |
|
Non-U.S. |
|
|
( |
) |
|
|
|
|
|
( |
) |
|
Total deferred |
|
|
( |
) |
|
|
|
|
|
( |
) |
|
Income taxes |
$ |
|
|
$ |
|
|
$ |
|
|
|||
A reconciliation of the U.S. federal statutory tax rate to the Company’s effective income tax rate is as follows:
|
|
Year ended May 31, |
|||||||||||||
|
|
2023 |
|
2022 |
|
2021 |
|||||||||
Federal statutory tax rate |
|
|
|
% |
|
|
|
% |
|
|
|
% |
|||
Increase/(decrease) resulting from: |
|
|
|
|
|
|
|
|
|
|
|
|
|||
State income taxes, net of federal tax benefit |
|
|
|
% |
|
|
|
% |
|
|
|
% |
|||
Tax-exempt municipal bond interest |
|
|
( |
) |
% |
|
|
( |
) |
% |
|
|
( |
) |
% |
Stock option windfall benefit |
|
|
( |
) |
% |
|
|
( |
) |
% |
|
|
( |
) |
% |
Tax credits |
|
|
( |
) |
% |
|
|
( |
) |
% |
|
|
( |
) |
% |
Other items |
|
|
|
% |
|
|
|
% |
|
|
|
% |
|||
Effective income tax rate |
|
|
|
% |
|
|
|
% |
|
|
|
% |
|||
The effective income tax rates in all periods were impacted by recognition of net discrete tax benefits related to employee stock-based compensation payments.
Uncertain income tax positions: The Company is subject to U.S. federal income tax, numerous local and state tax jurisdictions within the U.S., and taxes in Europe. The Company maintains a reserve for uncertain tax positions. As of May 31, 2023 and 2022, the total reserve for uncertain tax positions, including interest and net of federal benefits, was $
A reconciliation of the beginning and ending amounts of the Company’s gross unrecognized tax benefits, not including interest or other potential offsetting effects, is as follows:
|
|
Year ended May 31, |
|
||||||||||||
In millions |
|
2023 |
|
|
2022 |
|
|
2021 |
|
||||||
Balance as of beginning of fiscal year |
|
$ |
|
|
|
$ |
|
|
|
$ |
|
|
|||
Additions for tax positions of the current year |
|
|
|
|
|
|
|
|
|
|
|
|
|||
Additions for tax positions of prior years |
|
|
|
|
|
|
|
|
|
|
|
|
|||
Reductions for tax positions of prior years |
|
|
|
( | ) |
|
|
|
( | ) |
|
|
|
— |
|
Settlements with tax authorities |
|
|
|
( |
) |
|
|
|
( |
) |
|
|
|
( |
) |
Expiration of the statute of limitations |
|
|
|
( |
) |
|
|
|
( |
) |
|
|
|
( |
) |
Balance as of end of fiscal year |
|
$ |
|
|
|
$ |
|
|
|
$ |
|
|
|||
65
The reserve as of May 31, 2023 substantially relates to the Company’s uncertain tax positions for certain U.S. federal and state income tax matters. The Company believes the reserve for uncertain tax positions, including interest and net of federal benefits, of $
The Company has concluded all U.S. federal income tax matters through fiscal 2017. Fiscal years 2018 and 2020 are currently under audit by the IRS. With limited exception, state income tax audits by taxing authorities are closed through fiscal 2014, primarily due to expiration of the statute of limitations.
The Company continues to follow its policy of recognizing interest and penalties accrued on tax positions as a component of income taxes on the Consolidated Statements of Income and Comprehensive Income. The amount of accrued interest and penalties associated with the Company’s tax positions is immaterial to the Consolidated Balance Sheets. The amount of interest and penalties recognized for fiscal years 2023, 2022, and 2021 was immaterial to the Company’s results of operations.
Note L — Short-term Financing
The Company maintains committed and unsecured credit facilities and irrevocable letters of credit as part of its normal and recurring business operations. The purpose of these credit facilities is to meet short-term funding requirements, finance working capital needs, and for general corporate purposes. The Company typically borrows on an overnight or short-term basis on its credit facilities.
Details of the Company’s credit facilities as of May 31, 2023 are as follows:
|
|
|
|
Maximum |
|
|
Amount Outstanding |
|
|||||||||
|
|
|
|
Amount |
|
|
May 31, |
|
|||||||||
$ in millions |
|
Expiration Date |
|
Available |
|
|
2023 |
|
|
2022 |
|
||||||
Credit facilities: |
|
|
|
|
|
|
|
|
|
|
|
|
|
|
|||
JP Morgan Chase Bank, N.A. (“JPM”)(1) |
|
|
$ |
|
|
|
$ |
|
— |
|
|
$ |
|
— |
|
||
JPM (1) |
|
|
$ |
|
|
|
|
|
— |
|
|
|
|
— |
|
||
PNC Bank, National Association (“PNC”) (weighted-average interest |
|
|
$ |
|
|
|
|
|
|
|
|
|
|
||||
Outstanding short-term financing (2) |
|
|
|
|
|
|
|
$ |
|
|
|
$ |
|
|
|||
66
Upon the expiration date of any credit facility, any borrowings outstanding under that facility will mature and be payable.
Interest rates on each of the Company’s credit facilities can be based upon (1) an alternate base rate that is established by the lending institution at the highest of several publicly available interest rates, plus an applicable interest rate margin, or (2) at our election, London Interbank Offered Rate (“LIBOR”) or an alternate interest rate as determined by the administrative agent, plus an applicable interest rate margin. The Company is also required to pay a commitment fee, ranging from
On February 3, 2023, Paychex Advance LLC, a Paychex subsidiary and New York limited liability company, and Paychex entered into Amendment No. 2 (the “Amendment”) to the $
The Amendment, among other things, extended the maturity date of the 2020 Credit Facility from
On September 17, 2021, the Company amended its $
Obligations under the credit facilities are guaranteed by the Company and certain of its subsidiaries. The credit facilities contain financial and operational covenants with which the Company must maintain compliance. The Company’s ability to borrow under the credit facilities may be restricted in the event of certain covenant breaches or events of default. In addition, the terms of the credit facilities could restrict the Company’s ability to engage in certain business transactions. The Company was in compliance with all these covenants as of May 31, 2023.
Certain lenders under these credit facilities, and their respective affiliates, have performed, and may in the future perform for the Company, various commercial banking, investment banking, underwriting, and other financial advisory services, for which they have received, and will continue to receive in the future, customary fees and expenses.
Letters of credit: The Company had irrevocable standby letters of credit outstanding totaling $
Note M — Long-term Financing
Long-term debt, at amortized cost, consisted of the following as of:
|
|
May 31, |
|
|||||||
In millions |
|
2023 |
|
|
2022 |
|
||||
Senior Notes, Series A |
|
$ |
|
|
|
$ |
|
|
||
Senior Notes, Series B |
|
|
|
|
|
|
|
|
||
Total long-term borrowings |
|
|
|
|
|
|
|
|
||
Less: Debt issuance costs, net of accumulated amortization |
|
|
|
( |
) |
|
|
|
( |
) |
Long-term borrowings, net of debt issuance costs |
|
$ |
|
|
|
$ |
|
|
||
67
Certain information related to the Senior Notes, Series A and Senior Notes, Series B (collectively the “Notes”) issued pursuant to the Note Purchase and Guarantee Agreement (the “Agreement”) for fiscal 2023 and fiscal 2022 are as follows:
|
|
Senior Notes |
|
Senior Notes |
|
|
Series A |
|
Series B |
Stated interest rate |
|
|
||
Effective interest rate |
|
|
||
Interest rate type |
|
|
||
Interest payment dates |
|
|
||
Principal payment dates |
|
|
||
Note type |
|
|
The effective interest rates for each note series includes the interest on the note and amortization of debt issuance costs.
Payment of all amounts due with respect to the Notes and performance under the Agreement is guaranteed by the Company, Paychex of New York LLC, and certain other subsidiaries of the Company. The Company may, at its option, prepay at any time all, or any part of, the Notes, subject to certain conditions as described in the Agreement.
The Agreement contains customary representations, warranties, affirmative and negative covenants, including financial covenants that are usual and customary for such arrangements. The Company was in compliance with all these covenants as of May 31, 2023.
Note N — Supplemental Cash Flow Information
Income taxes paid were $
Interest expense paid was $
Refer to Note H of this Item 8 for supplemental cash flow information pertaining to the Company's leasing activities.
Note O — Employee Benefit Plans
401(k) plan: The Company maintains a contributory savings plan that qualifies under section 401(k) of the Internal Revenue Code. The Paychex, Inc. 401(k) Incentive Retirement Plan (the “Plan”) allows all employees to immediately participate in the salary deferral portion of the Plan, contributing up to a maximum of
The Plan is
Deferred compensation plans: The Company and certain subsidiaries offer non-qualified and unfunded deferred compensation plans to a select group of key employees, executive officers, and outside directors. Eligible employees are provided with the opportunity to defer up to
68
Note P — Commitments and Contingencies
Contingencies: The Company is subject to various claims and legal matters that arise in the normal course of its business. These include disputes or potential disputes related to breach of contract, tort, employment-related claims, tax claims, statutory, and other matters.
The Company’s management currently believes that resolution of any outstanding legal matters will not have a material adverse effect on the Company’s financial position or results of operations. However, legal matters are subject to inherent uncertainties and there exists the possibility that the ultimate resolution of these matters could have a material adverse impact on the Company’s financial position and the results of operations in the period in which any such effect is recorded.
Other commitments: As of May 31, 2023, the Company had outstanding commitments under existing workers’ compensation insurance agreements and legally binding contractual arrangements with minimum future payment obligations of approximately $
|
|
Payments due by period |
|
|||||||||||||||||||||||||||
In millions |
|
2024 |
|
|
2025 |
|
|
2026 |
|
|
2027 |
|
|
2028 |
|
|
Thereafter |
|
||||||||||||
Workers' compensation estimated obligations |
|
$ |
|
|
|
$ |
|
|
|
$ |
|
|
|
$ |
|
|
|
$ |
|
|
|
$ |
|
|
||||||
Purchase obligations |
|
|
|
|
|
$ |
|
|
|
$ |
|
|
|
$ |
|
|
|
$ |
|
|
|
$ |
|
|
||||||
In the normal course of business, the Company makes representations and warranties that guarantee the performance of services under service arrangements with clients. Historically, there have been no material losses related to such guarantees. The Company has also entered into indemnification agreements with its officers and directors, which require the Company to defend and, if necessary, indemnify these individuals for certain pending or future claims as they relate to their services provided to the Company.
The Company currently self-insures the deductible portion of various insured exposures under certain corporate employee and PEO employee health and medical benefit plans. The Company’s estimated loss exposure under these insurance arrangements is recorded in other current liabilities on the Consolidated Balance Sheets. Historically, the amounts accrued have not been material and were not material as of May 31, 2023. The Company also maintains insurance coverage in addition to its purchased primary insurance policies for gap coverage for employment practices liability, errors and omissions, warranty liability, theft and embezzlement, cyber threats, and acts of terrorism; and capacity for deductibles and self-insured retentions through its captive insurance company.
69
Schedule II — Valuation and Qualifying Accounts
PAYCHEX, INC.
CONSOLIDATED FINANCIAL STATEMENT SCHEDULE
FOR THE YEAR ENDED MAY 31,
(In millions)
|
|
|
|
|
|
|
|
|
|
Additions to/ |
|
|
|
|
|
|
|
|
|
||||||
|
|
Balance as of |
|
|
Additions |
|
|
(deductions |
|
|
|
|
|
|
Balance as |
|
|||||||||
|
|
beginning |
|
|
charged to |
|
|
from) other |
|
|
Costs and |
|
|
of end |
|
||||||||||
Description |
|
of fiscal year |
|
|
expenses |
|
|
accounts |
|
|
deductions(1) |
|
|
of fiscal year |
|
||||||||||
2023 |
|
|
|
|
|
|
|
|
|
|
|
|
|
|
|
|
|
|
|
|
|||||
Allowance for credit losses |
|
$ |
|
|
|
$ |
|
|
|
$ |
|
— |
|
|
$ |
|
|
|
$ |
|
|
||||
2022 |
|
|
|
|
|
|
|
|
|
|
|
|
|
|
|
|
|
|
|
|
|||||
Allowance for credit losses |
|
$ |
|
|
|
$ |
|
|
|
$ |
|
— |
|
|
$ |
|
|
|
$ |
|
|
||||
2021 |
|
|
|
|
|
|
|
|
|
|
|
|
|
|
|
|
|
|
|
|
|||||
Allowance for credit losses |
|
$ |
|
|
|
$ |
|
|
|
$ |
|
— |
|
|
$ |
|
|
|
$ |
|
|
||||
Item 9. Changes in and Disagreements with Accountants on Accounting and Financial Disclosure
None.
Item 9A. Controls and Procedures
Disclosure Controls and Procedures: Disclosure controls and procedures are designed with the objective of ensuring that information required to be disclosed in the Company’s reports filed under the Exchange Act, such as this report, is recorded, processed, summarized, and reported within the time periods specified in the SEC’s rules and forms. Disclosure controls and procedures are also designed with the objective of ensuring that such information is accumulated and communicated to the Company’s management, including the Company’s principal executive officer and principal financial officer, as appropriate, to allow timely decisions regarding required disclosure.
Conclusion Regarding the Effectiveness of Disclosure Controls and Procedures: As of the end of the period covered by this report, the Company carried out an evaluation, under the supervision and with the participation of the Company’s principal executive officer and principal financial officer, of the effectiveness of disclosure controls and procedures as defined in Rules 13a-15(e) and 15d-15(e) of the Exchange Act. Based on such evaluation, the Company’s principal executive officer and principal financial officer have concluded that as of May 31, 2023, the end of the period covered by this report, the Company’s disclosure controls and procedures were effective.
Changes in Internal Control Over Financial Reporting: The Company also carried out an evaluation of the internal control over financial reporting to determine whether any changes occurred during the fiscal quarter ended May 31, 2023. Based on such evaluation, there have been no changes in the Company’s internal control over financial reporting that occurred during the Company’s most recently completed fiscal quarter ended May 31, 2023, that materially affected, or are reasonably likely to materially affect, the Company’s internal control over financial reporting.
Internal Control Over Financial Reporting: The Report on Management’s Assessment of Internal Control Over Financial Reporting and the Report of Independent Registered Public Accounting Firm are included in Part II, Item 8 of this Form 10-K.
Item 9B. Other Information
None.
Item 9C. Disclosure Regarding Foreign Jurisdictions that Prevent Inspections
Not Applicable.
70
PART III
Item 10. Directors, Executive Officers and Corporate Governance
The following table shows the executive officers of the Company as of May 31, 2023, and information regarding their positions and business experience. Such executive officers hold principal policy-making powers at the Company.
Name |
|
Age |
|
Position and business experience |
John B. Gibson |
|
57 |
|
Mr. Gibson has served as President and CEO of the Company since October 2022. Prior to serving as President and CEO, Mr. Gibson was promoted to the role of President and Chief Operating Officer in December 2021, leading the daily operations of the company, including sales, service, marketing, and management. Mr. Gibson joined Paychex as Senior Vice President of Service in May 2013, bringing with him more than 20 years of experience in HR solutions, technology, and business services. Prior to Paychex, Mr. Gibson served in senior executive positions at HR outsourcing and technology companies, including Ameritech (now AT&T) and Convergys, where he served as president of the HR management division providing comprehensive global HR solutions to clients in 68 countries. |
Efrain Rivera |
|
66 |
|
Mr. Rivera joined Paychex in June 2011 and now serves as Senior Vice President and Chief Financial Officer. Prior to joining the Company, Mr. Rivera served as Vice President of Finance and Administration for Houghton College from 2009 to 2011. He previously served for over twenty years with Bausch & Lomb Incorporated, a world leader in the development, manufacture, and marketing of eye health products, most recently as Corporate Vice President and Chief Financial Officer from 2007 to 2009. |
Mark A. Bottini |
|
62 |
|
Mr. Bottini joined Paychex in October 2011 as Senior Vice President of Sales. From 2008 to 2011, Mr. Bottini served as Vice President of Sales for Ricoh, North America, a provider of advanced office technology and innovative document imaging products, services, and software. He assumed his most recent position with Ricoh when Ricoh acquired IKON Office Solutions, Inc. During his nearly 20 years with IKON, Mr. Bottini served in a variety of sales leadership and field management roles. |
71
Name |
|
Age |
|
Position and business experience |
Michael E. Gioja |
|
65 |
|
Mr. Gioja was named Senior Vice President of Information Technology and Product Development in July 2011. Mr. Gioja has been with the Company since November 2008 and previously served as Senior Vice President of Information, Technology, Product Management, and Development and Vice President of Product Management. Previously, he was Chief Information Officer and Executive Vice President of Products and Services for Workstream, Inc., a provider of on-demand enterprise talent management solutions and services. |
Elizabeth Roaldsen |
|
51 |
|
Ms. Roaldsen joined the Company in May 2023 as Senior Vice President of Operations and Customer Experience. Prior to joining the Company, she served as Managing Director, head of enterprise business services, and wholesale banking at HSBC from 2021 through 2023. Previously, Ms. Roaldsen served in various roles of increasing responsibility at State Street Corporation from 2010 to 2021, most recently as Executive Vice President Head of Global Operations and Asset Servicing. |
Karen E. Saunders McClendon |
|
57 |
|
Ms. Saunders McClendon joined the Company in April 2021 as Vice President and Chief Human Resources Officer. Prior to joining the Company, she served as Vice President of Human Resources for Comcast Cable from 2013 to 2021. From 2009 to 2013, she served as Vice President of Human Resources for Aramark. |
Stephanie L. Schaeffer |
|
53 |
|
Ms. Schaeffer was named Vice President and Chief Legal Officer in January 2006. In 2011, she was appointed Corporate Secretary. She joined Paychex in 2000 as Corporate Counsel and was promoted to Director of Legal Affairs in 2004. In her current role, she is responsible for overseeing all the Company's legal functions, including litigation, corporate governance, and regulatory matters. |
Robert L. Schrader |
|
51 |
|
Mr. Schrader was named Vice President, Finance and Investor Relations in January 2023. He joined the Company in December 2014 and previously held roles as Vice President and Controller, Senior Director of Financial Planning and Analysis and Director of Internal Audit. Prior to joining Paychex, he served as a Chief Financial Officer for Unither Manufacturing, LLC, and held various senior management positions during his ten-year career at Bausch & Lomb, including Vice President of Finance and Controller of Global Quality and Operations. Previously in his career, he held leadership roles with a public accounting firm. |
The additional information required by this item is set forth in the Company’s Definitive Proxy Statement for its 2023 Annual Meeting of Stockholders, anticipated to be held on or about October 12, 2023, in the sections “PROPOSAL 1: ELECTION OF DIRECTORS FOR A ONE-YEAR TERM,” “CORPORATE GOVERNANCE,” and “CODE OF BUSINESS ETHICS AND CONDUCT” and is incorporated herein by reference.
Item 11. Executive Compensation
The information required by this item is set forth in the Company’s Definitive Proxy Statement for its 2023 Annual Meeting of Stockholders, anticipated to be held on or about October 12, 2023, in the sections “COMPENSATION DISCUSSION AND ANALYSIS,” “NAMED EXECUTIVE OFFICER COMPENSATION,” “DIRECTOR COMPENSATION FOR THE FISCAL YEAR ENDED MAY 31, 2023,” “THE COMPENSATION AND LEADERSHIP COMMITTEE REPORT” and the sub-heading “Compensation and Leadership Committee Interlocks and Insider Participation” within the section “CORPORATE GOVERNANCE” and is incorporated herein by reference.
Item 12. Security Ownership of Certain Beneficial Owners and Management and Related Stockholder Matters
The information required by this item is set forth below and in the Company’s Definitive Proxy Statement for its 2023 Annual Meeting of Stockholders, anticipated to be held on or about October 12, 2023, under the section “BENEFICIAL OWNERSHIP OF PAYCHEX COMMON STOCK,” and is incorporated herein by reference.
The Company maintains equity compensation plans in the form of stock incentive plans. Under the Paychex, Inc. 2002 Stock Incentive Plan, as last amended and restated effective October 15, 2020 (the “2002 Plan”), non-qualified or incentive stock options, restricted stock, restricted stock units, performance shares, and performance stock options have been awarded to
72
employees and the Board. The 2002 Plan was adopted on July 9, 2020 by the Board and became effective upon stockholder approval at the Company’s Annual Meeting of Stockholders held on October 15, 2020. Refer to Note E of the Notes to Consolidated Financial Statements, contained in Item 8 of this Form 10-K, for more information on the Company’s stock incentive plans.
The following table details information on securities authorized for issuance upon the exercise of outstanding options under the Company’s equity compensation plans as of May 31, 2023:
In millions, except per share amounts |
|
Number of securities to be issued upon exercise of outstanding options |
|
|
Weighted-average exercise price of outstanding options |
|
|
Number of securities remaining available for future issuance under equity compensation plans(1) |
|
||||||
Equity compensation plans approved by security holders |
|
|
|
3.8 |
|
|
$ |
|
72.52 |
|
|
|
|
14.2 |
|
Item 13. Certain Relationships and Related Transactions, and Director Independence
The information required by this item is set forth in the Company’s Definitive Proxy Statement for its 2023 Annual Meeting of Stockholders, anticipated to be held on or about October 12, 2023, under the sub-headings “Board Meetings and Committees,” “Policy on Transactions with Related Persons,” and “Transactions with Related Persons” within the section “CORPORATE GOVERNANCE,” and is incorporated herein by reference.
Item 14. Principal Accounting Fees and Services
The information required by this item is set forth in the Company’s Definitive Proxy Statement for its 2023 Annual Meeting of Stockholders, anticipated to be held on or about October 12, 2023, under the section “PROPOSAL 4: RATIFICATION OF THE SELECTION OF OUR INDEPENDENT REGISTERED PUBLIC ACCOUNTING FIRM,” and is incorporated herein by reference.
73
PART IV
Item 15. Exhibits and Financial Statement Schedules
|
|
|
|
|
|
|
|
|
|
|
|
(a) |
|
|
Financial Statements, Financial Statement Schedules, and Exhibits |
||
1. |
|
|
Financial Statements See Financial Statements and Supplementary Data Table of Contents at page 36. |
||
2. |
|
|
Financial Statement Schedules |
||
|
|
|
Financial statement schedules required to be filed by Item 8 of this Form 10-K include Schedule II — Valuation and Qualifying Accounts. See Financial Statements and Supplementary Data Table of Contents at page 36. All other schedules are omitted as the required matter is not present, the amounts are not significant, or the information is shown in the financial statements or the notes thereto. |
||
3. |
|
|
Exhibits |
||
|
|
|
(2.1) |
|
|
|
|
|
(3)(a) |
|
|
|
|
|
(3.1) |
|
|
|
|
|
(4.1) |
|
|
|
|
|
(4.2) |
|
|
|
|
|
(4.3) |
|
|
# |
|
|
(10.1) |
|
|
# |
|
|
(10.2) |
|
|
# |
|
|
(10.3) |
|
|
# |
|
|
(10.4) |
|
|
# |
|
|
(10.5) |
|
|
# |
|
|
(10.6) |
|
|
# |
|
|
(10.7) |
|
|
|
|
|
(10.8) |
|
|
# |
|
|
(10.9) |
|
|
# |
|
|
(10.10) |
|
|
# |
|
|
(10.11) |
|
|
74
# |
|
|
(10.12) |
|
|
# |
|
|
(10.13) |
|
|
|
|
|
(10.14) |
|
|
# |
|
|
(10.15) |
|
|
# |
|
|
(10.16) |
|
|
# |
|
|
(10.17) |
|
|
# |
|
|
(10.18) |
|
|
# |
|
|
(10.19) |
|
|
|
|
|
(10.20) |
|
|
|
|
|
(10.21) |
|
|
|
|
|
(10.22) |
|
|
|
|
|
(10.23) |
|
|
|
|
|
(10.24) |
|
|
# |
|
|
(10.25) |
|
|
|
|
|
(10.26) |
|
|
# |
|
|
(10.27) |
|
|
# |
|
|
(10.28) |
|
|
# |
|
|
(10.29) |
|
75
|
|
|
|
|
|
# |
|
|
(10.30) |
|
|
# |
|
|
(10.31) |
|
|
# |
|
|
(10.32) |
|
|
# |
|
|
(10.33) |
|
|
# |
|
|
(10.34) |
|
|
# |
|
|
(10.35) |
|
|
* |
|
|
(21.1) |
|
|
* |
|
|
(23.1) |
|
Consent of Independent Registered Public Accounting Firm, PricewaterhouseCoopers LLP. |
* |
|
|
(24.1) |
|
|
* |
|
|
(31.1) |
|
Certification Pursuant to Section 302 of the Sarbanes-Oxley Act of 2002. |
* |
|
|
(31.2) |
|
Certification Pursuant to Section 302 of the Sarbanes-Oxley Act of 2002. |
* |
|
|
(32.1) |
|
|
* |
|
|
(32.2) |
|
|
* |
|
|
101.INS |
|
Inline XBRL Instance Document – the instance document does not appear in the Interactive Data File because XBRL tags are embedded within the XBRL Document. |
* |
|
|
101.SCH |
|
Inline XBRL Taxonomy Extension Schema Document. |
* |
|
|
101.CAL |
|
Inline XBRL Taxonomy Extension Calculation Linkbase Document. |
* |
|
|
101.LAB |
|
Inline XBRL Taxonomy Extension Label Linkbase Document. |
* |
|
|
101.PRE |
|
Inline XBRL Taxonomy Extension Presentation Linkbase Document. |
* |
|
|
101.DEF |
|
Inline XBRL Taxonomy Extension Definition Linkbase Document. |
* |
|
|
104 |
|
Cover Page Interactive Data File (embedded within the Inline XBRL document). |
* |
Exhibit filed or furnished with this report. |
|
|
# |
Management contract or compensatory plan. |
Item 16. Form 10-K Summary
None.
76
SIGNATURES
Pursuant to the requirements of Section 13 or 15(d) of the Securities Exchange Act of 1934, the registrant has duly caused this report to be signed on its behalf by the undersigned, thereunto duly authorized, on July 14, 2023.
PAYCHEX, INC.
By: /s/ John B. Gibson
John B. Gibson
President and Chief Executive Officer
Pursuant to the requirements of the Securities Exchange Act of 1934, this report has been signed below by the following persons on behalf of the registrant and in the capacities indicated on July 14, 2023.
/s/ John B. Gibson |
|
John B. Gibson, President, Chief Executive Officer, and Director |
|
(Principal Executive Officer) |
|
/s/ Efrain Rivera |
|
Efrain Rivera, Senior Vice President and Chief Financial Officer |
|
(Principal Financial Officer) |
|
/s/ Robert L. Schrader |
|
Robert L. Schrader, Vice President, Finance and Investor Relations |
|
(Principal Accounting Officer) |
|
Martin Mucci*, Director
Thomas F. Bonadio*, Director
Joseph G. Doody*, Director
David J.S. Flaschen*, Director
B. Thomas Golisano*, Director
Pamela A. Joseph*, Director
Theresa M. Payton*, Director
Kevin A. Price*, Director
Joseph M. Tucci*, Director
Joseph M. Velli*, Director
Kara Wilson*, Director
*By: /s/ John B. Gibson |
|
John B. Gibson, as Attorney-in-Fact |
|
77